
Figure 7. Bromocriptine and analogs tested in a rat model of stroke and mouse model of diet-induced obesity.
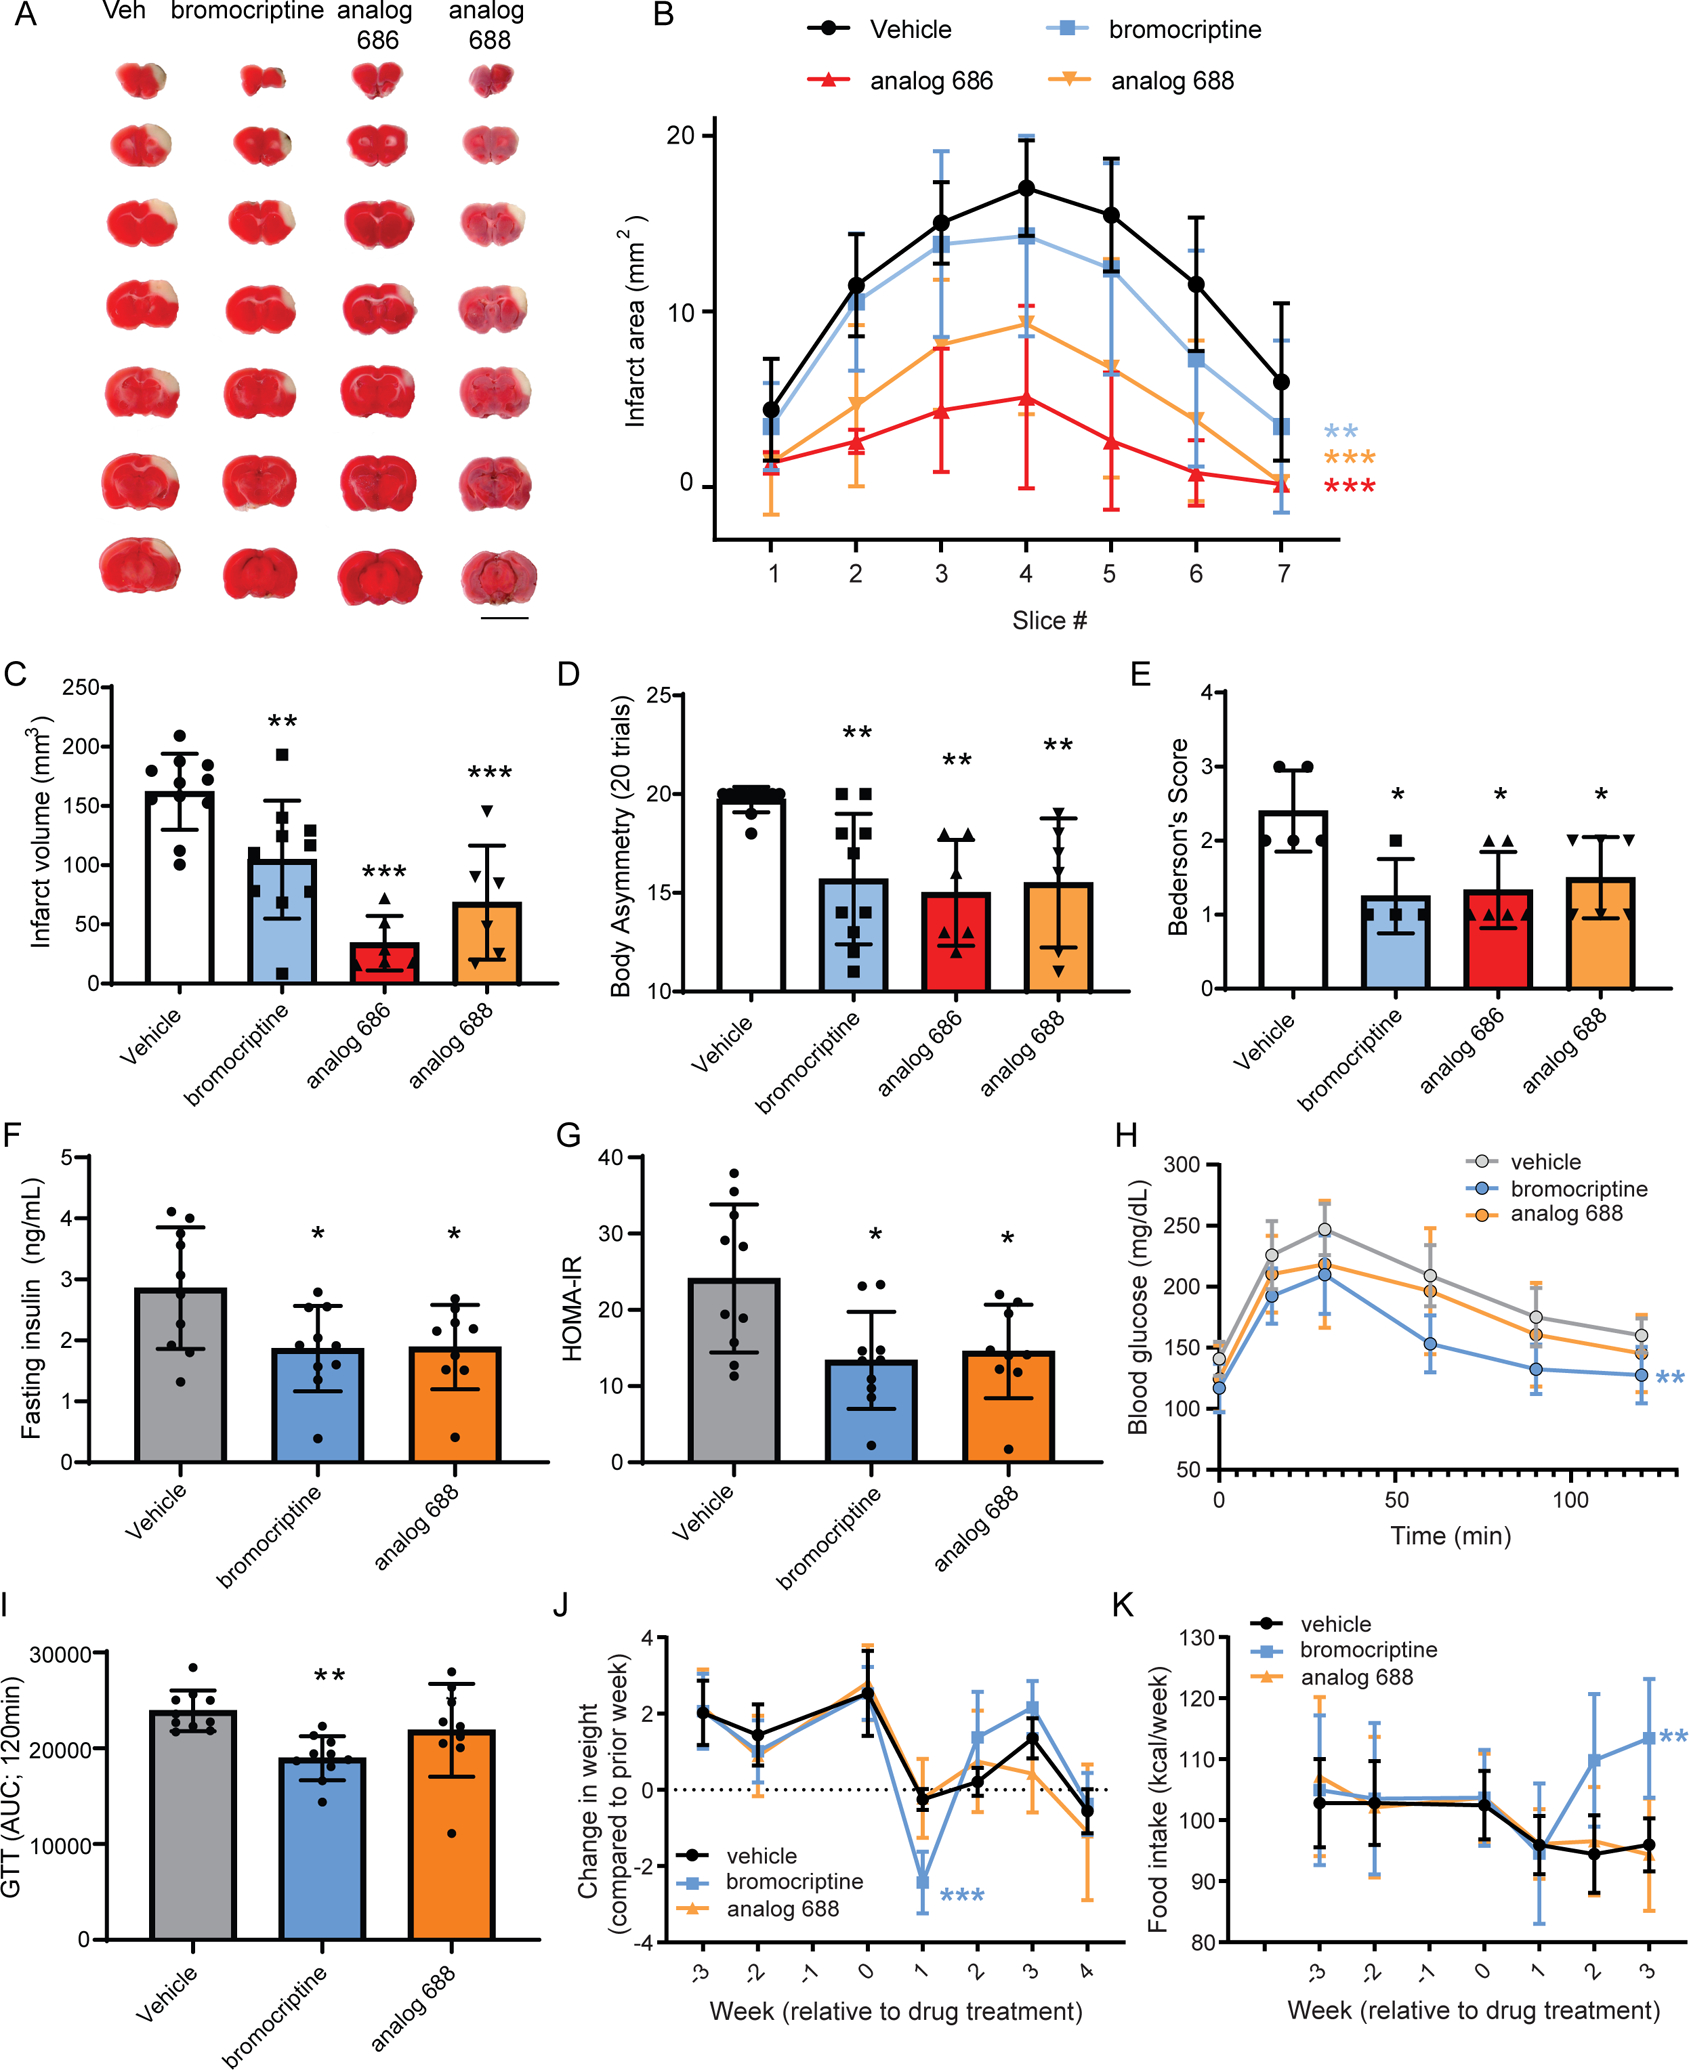
(A) Representative TTC stained rat brain slices (2 mm) showing the area of infarction 2 days following administration of bromocriptine analogs and MCAo. Red indicates metabolically active brain areas, while white areas are indicative of infarct tissue. Scale bar is 1 cm. (B) Quantitative analysis of the area of infarction per 2-mm brain slice from rostral to caudal (n=6–11 rats per each group, two-way ANOVA with Dunnett’s multiple comparisons test versus vehicle, **p<0.01, ***p<0.001). (C) Total infarct volume measured across slices (n=6–11 rats, one-way ANOVA with Dunnett’s multiple comparisons test versus vehicle, ** p<0.01, *** p<0.001). (D) Body asymmetry test and (E) Bederson’s test for neurological abnormality scores were performed to assess stroke-related behaviors (n=6–11 rats body asymmetry and n=4–6 rats Bederson’s test, one-way ANOVA with Dunnett’s multiple comparisons test versus vehicle, *p<0.05, ** p<0.01, *** p<0.001). All data mean ± SD. (F,G) Adult male mice on a high fat diet for eight weeks were injected daily (i.p.) with vehicle, 12 mg/kg bromocriptine, or 12 mg/kg analog 688 over 3 weeks while remaining on the high fat diet. (F) Fasting insulin and (G) insulin resistance index (HOMA-IR) were measured after 3 weeks of drug treatment. (H) Glucose clearance is improved by bromocriptine. (I) The area under the curve analysis of the glucose clearance in panel C. (J) Weight change per week identifies a significant decline after the first week of bromocriptine injections compared to vehicle or analog 688. (K) Food intake significantly increased following bromocriptine administration during the 2nd and 3rd weeks of injection. Data are mean +/− SD. Statistical differences are based on one-way ANOVA followed by Tukey post hoc multiple comparisons test, *p<0.05 vs vehicle (F,G), **p<0.01 bromocriptine vs vehicle (I) ***p<0.001 bromocriptine vs vehicle and analog 688 at 1 week post-injection (J); two-way ANOVA, Dunnett’s post hoc test, **p<0.01 bromocriptine vs vehicle (H) and (K) week 1–3 drug treatment period. See also Figure S7.