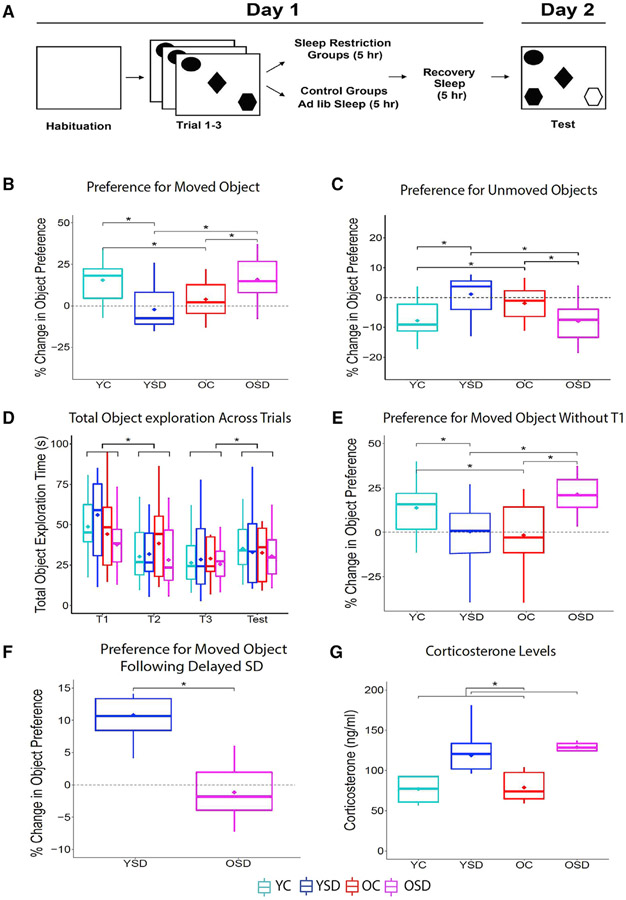
Figure 1. OPR behavioral performance.
(A) Schematic of behavioral paradigm.
(B) Percent change in preference for displaced object (young control [YC]: n = 16; young SD [YSD]: n = 15; old control [OC]: n = 13; old SD [OSD]: n = 15).
(C) Total object exploration time during training and testing.
(D) Percent change in preference for displaced object in young (n = 6) and old (n = 7) mice receiving delayed SD (5 h after training).
(E) Levels of plasma corticosterone (YC: n = 5; OC: n = 5; YSD: n = 5; OSD: n = 6).
In all figures, data are graphed using boxplots where the inner line corresponds to the median, the lower box the first quartile, the upper box the third quartile, the extending lines (whiskers) the minimum and maximum, and the diamond the trimmed mean used for analysis. The trimmed mean was set at 0.2 for all age groups and sleep conditions. T1–T3, training trials. Asterisks (*) represent significance using alpha = 0.05. Statistical details are in Data S1.

