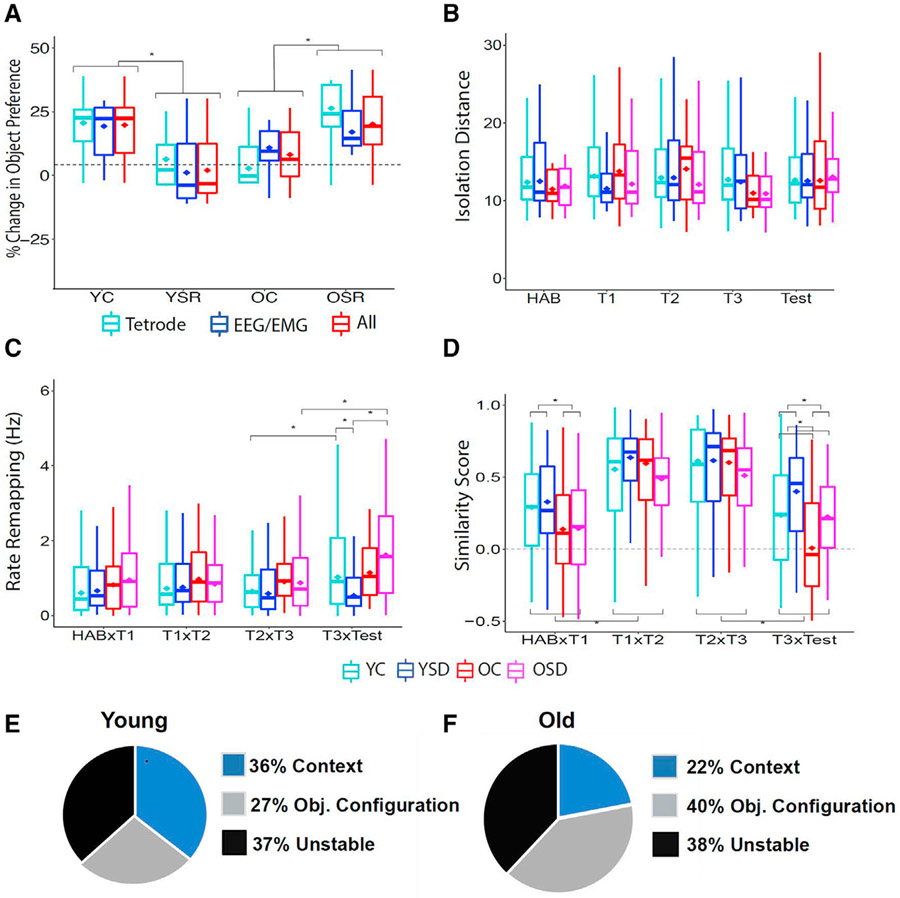
Figure 2. Rate and global remapping and percentage of different cell types during OPR performance.
(A) Performance comparing animals implanted with tetrodes or EEG/EMG.
(B) Cluster isolation distance.
(C) Average rate remapping for all groups across trials.
(D) Average global remapping (map similarity) for all groups across trials.
(E and F) Percentage of context, object configuration, and unstable cells recorded in young (E) and old (F) mice.
YC: 6 mice, 60 cells, range of cells per animal: 6–16; YSD: 4 mice, 50 cells, range of cells per animal: 8–18; OC: 5 mice, 36 cells, range of cells per animal: 5–13; OSD: 5 mice, 41 cells: range of cells per animal: 4–13. Hab, habituation. Asterisks (*) represent significance using alpha = 0.05. Statistical details are in Data S1.

