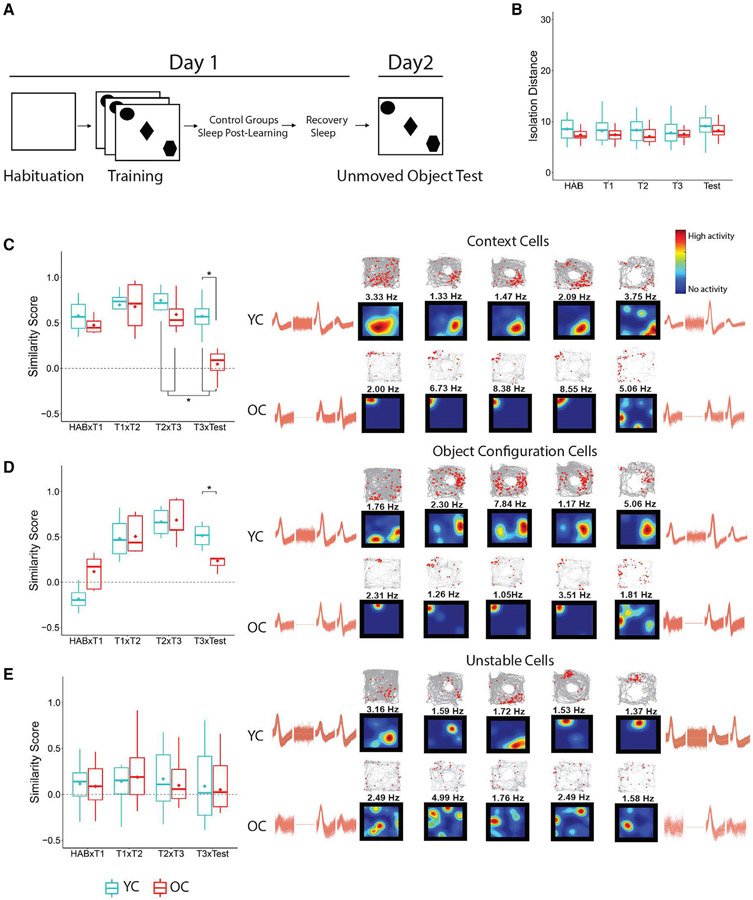
Figure 4. Place cell stability during unmoved object control task.
(A) Schematics of the task.
(B) Isolation distance.
(C–E) Examples of context (C), object configuration (D), and unstable (E) rate maps, trajectory spike maps, and waveforms recorded from young and old control mice trained in the unmoved object control task. Color code is the same as Figure 3. Waveform similarity indicates recording stability during the 24-h period of training and testing.
YC: 3 mice, 30 cells; OC: 4 mice, 24 cells. Asterisks (*) represent significance using alpha = 0.05. Statistical details are in Data S1.

