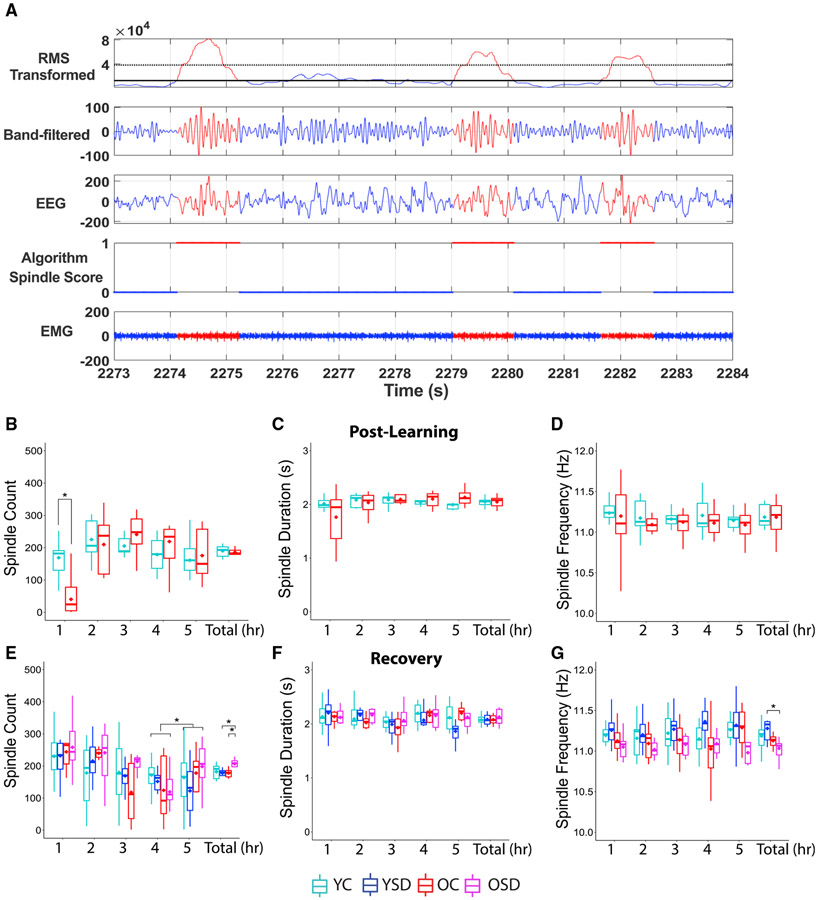
Figure 6. Spindle characteristics.
(A) Representation of the automated spindle-detection method. Top panel shows cubed root-mean-square (RMS) of the filtered EEG. The second, third, and fourth panels show the band-pass filtered EEG, the unfiltered EEG, and the results of the spindle detection, respectively. The bottom panel depicts the corresponding EMG signal. Red marks the regions of the signal where spindles are detected; 1 indicates the presence and 0 the absence of spindles.
(B–D) Spindle counts (B), duration (C), and frequency (D) during the post-learning sleep.
(E–G) Spindle numbers (E), duration (F), and frequency (G) during recovery.
YC: n = 11; YSD: n = 11; OC: n = 8; OSD: n = 10. Asterisks (*) represent significance using alpha = 0.05. Statistical details are in Data S1.

