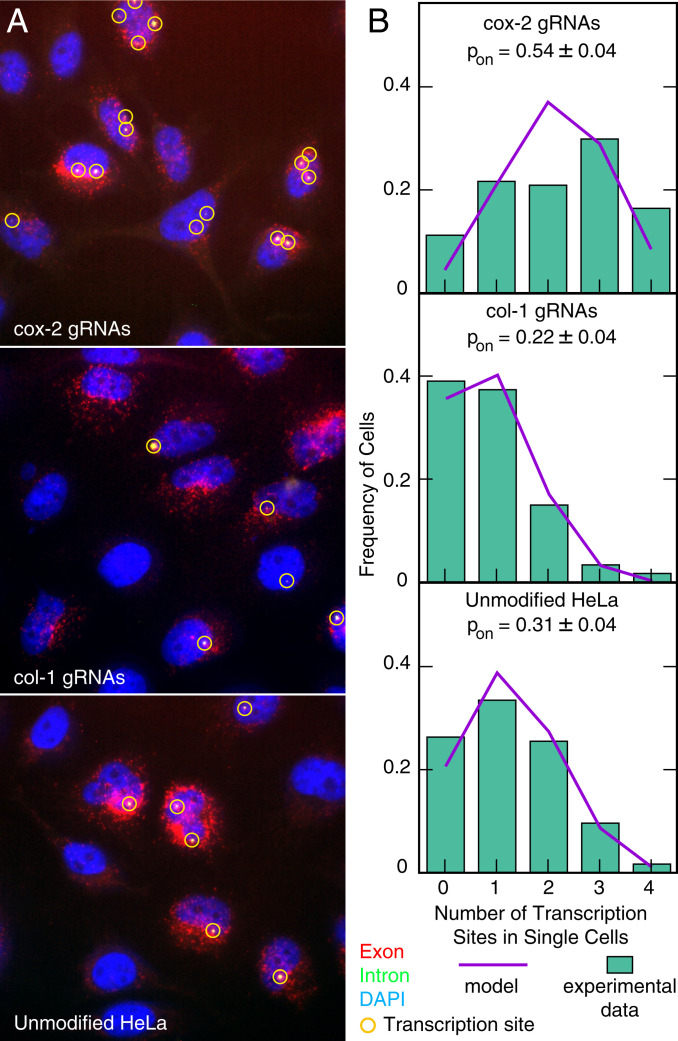
Fig. 3.
Analysis of the number of transcriptionally active cox-2 gene loci (out of four alleles present in HeLa cells) 4 h after serum induction. (A) Representative images of cox-2 mRNA imaged using exon-specific (red) and intron-specific smFISH (green) probe sets from cell lines expressing dCas9 and cox-2 gRNAs, dCas9 and col-1 gRNAs, and unmodified HeLa cells. The images are color-coded, maximum intensity–merged z-stacks. Intron-specific probes in this case reveal only the nascent mRNAs that are yet to be released from the gene loci, whereas the exon-specific probes reveal both the nascent RNAs at the gene locus and the mature mRNAs dispersed throughout the cell. Algorithmically identified transcription sites are marked by yellow circles. (B) The distribution of the number of active transcription sites from 130 to 140 cells (bars) and their best fits to the binomial distribution considering the four copies of the gene are identical and independent (lines). The probabilities of a gene locus being on and their 95% CI are shown.

