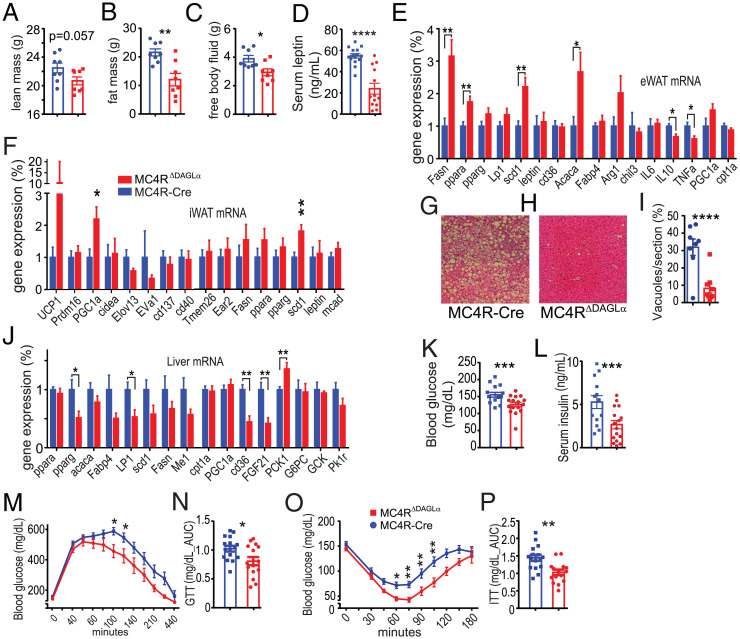
Fig. 3.
Deletion of 2-AG synthesis in MC4R neurons protects against obesogenic and diabetegenic challenges. (A–C) Bar graphs indicate parameters of body composition of 50-wk-old male MC4RΔDAGLα (n = 8) and MC4R-Cre (n = 8) mice after 12 wk of feeding ad libitum on HFD by using TD-NMR systems, (A) the absolute amount lean mass, (B) the absolute amount fat mass, and (C) the absolute mass of free body fluid (unpaired t test). (D) Bar graphs indicate serum levels of leptin in MC4RΔDAGLα (n = 13) and MC4R-Cre (n = 15) mice (unpaired t test). (E and F) The expression of certain genes normalized to TBP mRNA expression obtained by using qRT-PCR in eWAT and iWAT (unpaired t test). (G–I) Representative hematoxylin and eosin–stained sections of liver samples and the average fat vacuole sizes measured from liver sections from MC4RΔDAGLα (n = 17) and MC4R-Cre (n = 14) mice. (J) The expression of certain relevant genes normalized to TBP mRNA expression obtained by using qRT-PCR from liver (unpaired t test). (K and L) Bar graphs indicate fasting blood glucose and serum insulin levels in MC4RΔDAGLα (n = 16) mice and MC4R-Cre (n = 14) mice (unpaired t test). (M) Graphs indicate GTT in 50-wk-old male MC4RΔDAGLα (n = 17) and MC4R-Cre (n = 14) mice after feeding on HFD ad libitum for 12 wk. Blood glucose levels were repetitively measured for 5 h following single ip injections of 2 gm/kg of body weight. (two-way ANOVA, Sidak's multiple-comparisons test). (N) The bar graphs indicate the AUC of blood glucose levels within the 4 h post glucose injections from experiment in M (unpaired t test). (O) Graphs indicate insulin tolerance testing performed in the same group of mice as in M showing blood glucose levels measured up to 3 h post ip injections of insulin 1 U/kg (two-way ANOVA, Sidak's multiple-comparisons test). (P) Bar graphs indicate the AUC of blood glucose levels within 3 h post insulin injections from experiments in O (unpaired t test). Data are presented as mean ± SEM. ns indicates P > 0.05, * indicates P < 0.05, ** indicates P < 0.01, *** indicates P < 0.001, and **** indicates P < 0.0001.

