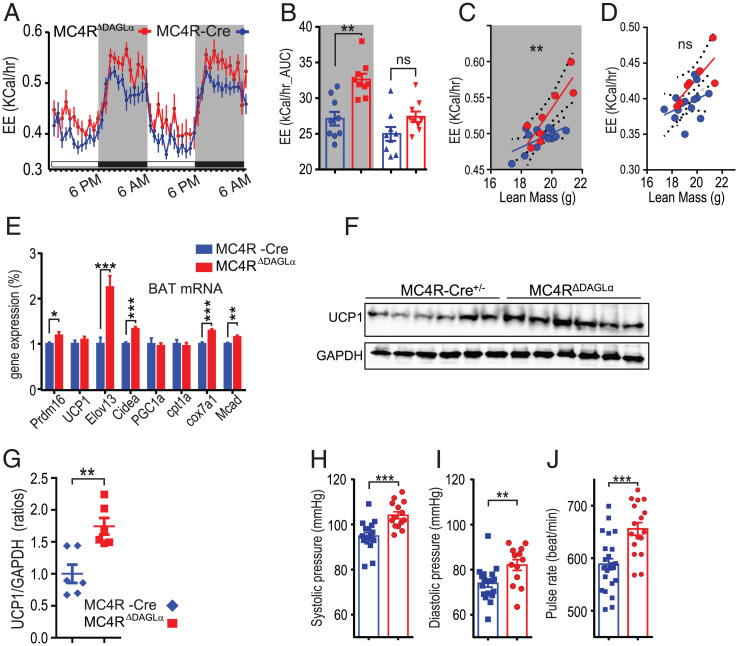
Fig. 4.
Deletion of 2-AG synthesis from MC4R neurons results in increased energy expenditure, BAT-mediated thermogenic response and β-oxidation, and cardiovascular output. (A) Graphs indicate the energy expenditure of normal chow ad libitum–fed 30 wk-old male MC4RΔDAGLα (n = 7) and MC4R-Cre mice (n = 7) during 2 d. (B) The graphs indicate the AUC of energy expenditure (kilocalories/hour) from two dark (gray shade) and two light cycles from A (one-way ANOVA, Tukey's multiple-comparisons test). (C) The analysis of covariance (ANCOVA) of energy expenditure normalized to animal’s lean body mass (LBM) between MC4R-Cre and MC4RΔDAGLα mice indicate the slopes of energy expenditure in MC4R-Cre (0.009 ± 0.004) and MC4RΔDAGLα mice (0.03 ± 0.007) in the dark cycle (P = 0.008). (D) ANCOVA of energy expenditure indicate the slopes of energy expenditure from MC4R-Cre (0.0086 ± 0.006) and MC4RΔDAGLα (0.021 ± 0.007) mice in the light cycle (P = 0.24). (C and D ANCOVA). (E) The expression of indicated thermogenic genes normalized to TBP mRNA expression obtained by using qRT-PCR from BAT (unpaired t test). (F and G) UCP1 and GAPDH protein expression in the BAT of the MC4R-Cre and MC4RΔDAGLα mice analyzed by Western blot (F) and its quantification (G). (H–J) Bar graphs indicate the systolic (H) and diastolic (I) pressure and pulse rate (J) from 30-wk-old normal chow ad libitum–fed MC4RΔDAGLα mice (n = 14) and MC4R-Cre mice (n = 18) measured using the noninvasive tail-cuff (unpaired t test). Data are presented as mean ± SEM. ns indicates P > 0.05, * indicates P < 0.05, ** indicates P < 0.01, *** indicates P < 0.001, and **** indicates P < 0.0001.

