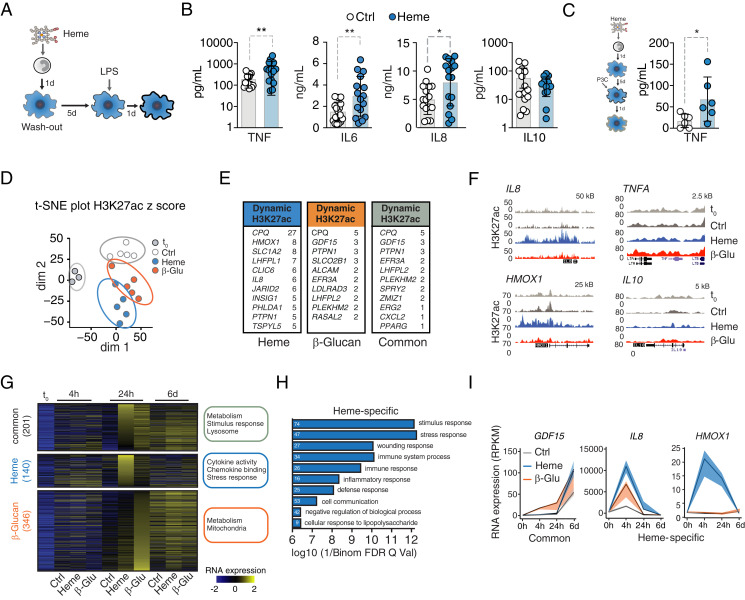
Fig. 1.
Heme imposes trained immunity and evokes a specific transcriptional signature. (A) Experimental setup. (B) Cytokine release from vehicle- or heme-trained (50 μM) Mφ after LPS restimulation (10 ng/mL) at day 7, measured with LegendPlex. IL-8 measurement by enzyme-linked immunosorbent assay. n = 16 independent donors. (C) TNF release from vehicle- or heme-pretreated Mφ second hit at day 7 with Pam3CSK4. n = 6 independent donors. (D) t-distributed stochastic neighbor embedding (t-SNE) plot of dynamic acetylation peaks in monocytes and vehicle, heme, or β-glucan Mφ 24 h after stimulation. Dim1: differentiation processes. Dim2: variation because of treatment. (E) Genes with highest number of differential H3K27ac peaks within 1 Mb of their TSS. (F) Representative gene loci. (G–I) Transcriptional analysis by RNA-seq. (G) Heatmap of regulated genes at baseline (t0) and at indicated time points after heme or β-glucan exposure. GO terms are listed next to each group of genes. (H) Most abundant pathways based on gene expression analysis 24 h after treatment. White numbers indicate the number of affected genes. (I) Time-resolved expression patterns of genes found with increased H3K27ac. All analyses were performed from n = 5 individual donors. All data mean ± SD unless otherwise stated. Student’s t test, *P ≤ 0.05; **P ≤ 0.01. β-Glu, β-glucan; Ctrl. control; d, days; h, hours; H3K27ac, histone 3 lysine 27 acetylation; HMOX1, heme oxygenase 1; P3C, Pam3CSK4; t0, baseline before stimulation; dim, dimension.

