Fig. 4.
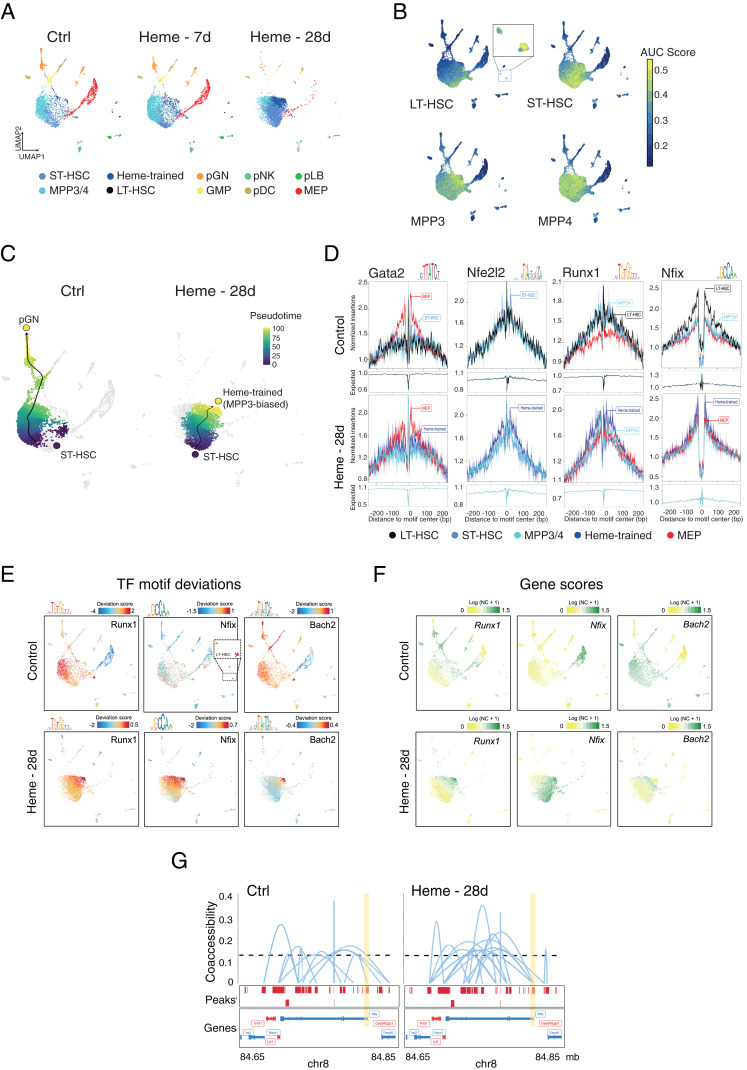
Single-cell epigenetic landscape of heme-trained HSPCs in mice. (A) UMAP projection of 4,842 (Control), 5,562 (Heme 7d), and 6,052 (Heme 28d) single-nuclei (sn) ATAC profiles from sorted bone marrow–derived LSK cells. Each dot represents an individual cell, and colors represent the identity of the cluster. An annotation of the clusters was performed according to the overlay of epigenetic signatures (ImmGen Database) and known marker genes per cell type. (B) Enrichment of epigenomic ImmGen Database signatures (area under the curve [AUC] scores) of the HSPCs onto UMAP projection of LSK cells. (C) Pseudotime trajectory of pGN differentiation and heme-trained cells from ST-HSCs in control LSK cells and after 28 d of heme training, respectively. (D) TF footprint analysis in the indicated snATAC-seq clusters of non- and heme-treated LSK cells subtracted for Tn5 insertion bias shown below. (E) TF motif scores from bone marrow cells projected onto the UMAP. (F) UMAP projection colored by log-normalized gene scores calculated on the individual LSK cell types. (G) Enhancer–promoter connections (coaccessibility) of the Nfix locus in control- and heme-trained cells. The height of connections indicates the coaccessibility score between the connected peaks. Ctrl, control; pGN, precursor of granulocytes; pDC, precursor of dendritic cells; pNK, precursor of NK cells; pLB, precursor of B lymphocytes; NC, normalized count.

