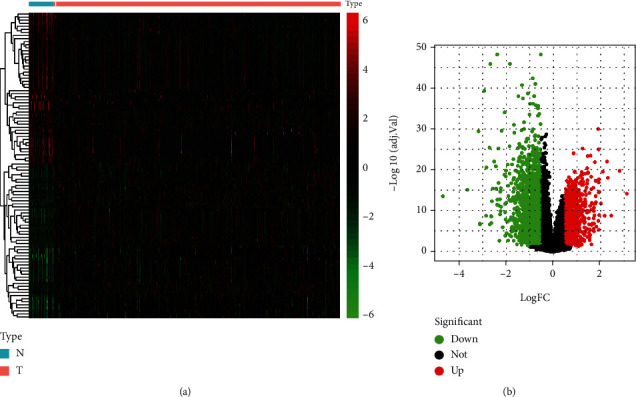
Figure 1.

Differentially expressed genes (DEGs) obtained. (a) The heatmap of DEG expression level in GC samples. (b) The volcano plot of DEGs in GC. Red and blue indicate upregulation and downregulation, respectively. N: normal sample; T: tumor tissues.
