Figure 11.

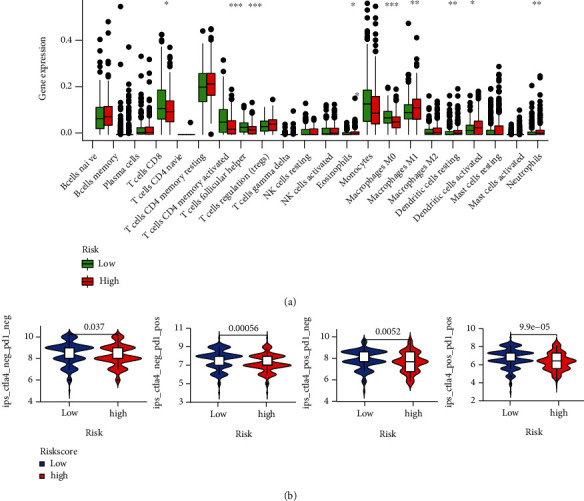
(a) Relative proportion of immune infiltration in high- and low-risk patients of the TCGA cohort. (b) Difference analysis of IPS between the low- and high-risk groups of the 3-gene model. ∗P < 0.05; ∗∗P < 0.01; ∗∗∗P < 0.005.

(a) Relative proportion of immune infiltration in high- and low-risk patients of the TCGA cohort. (b) Difference analysis of IPS between the low- and high-risk groups of the 3-gene model. ∗P < 0.05; ∗∗P < 0.01; ∗∗∗P < 0.005.