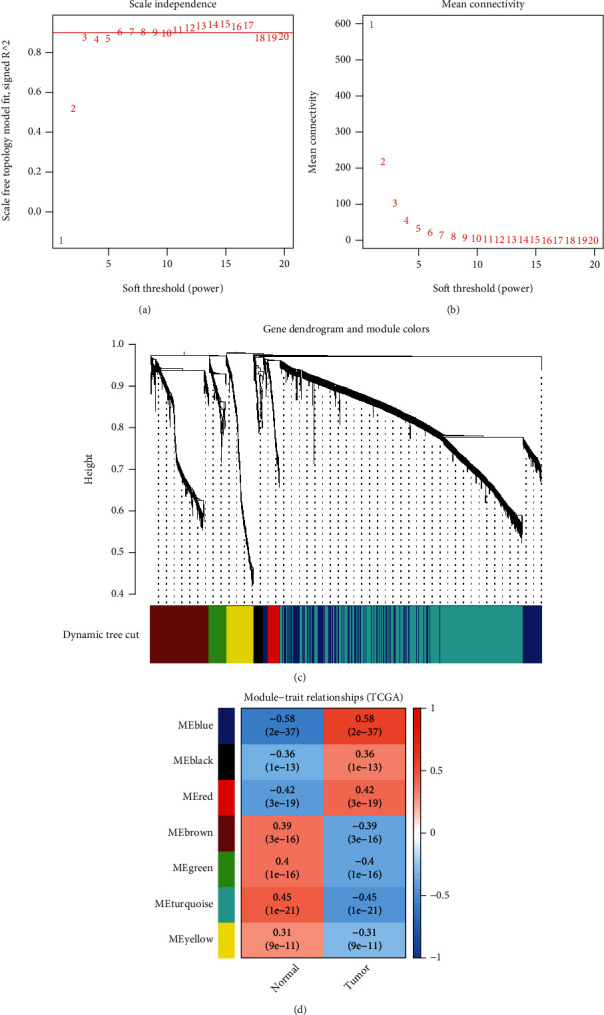
Figure 2.

Identification of GC-related module genes by WGCNA. (a) The optimal power was 3 when the red guideline was set to 0.89. The mean connectivity of different soft-threshold powers. (b) Clustering of the dendrogram and corresponding modules. (c) Heatmap showing the correlation of gene modules with GC samples or normal samples. (d) Heatmap showing the correlation of gene modules with GC samples or normal samples.
