Figure 3.

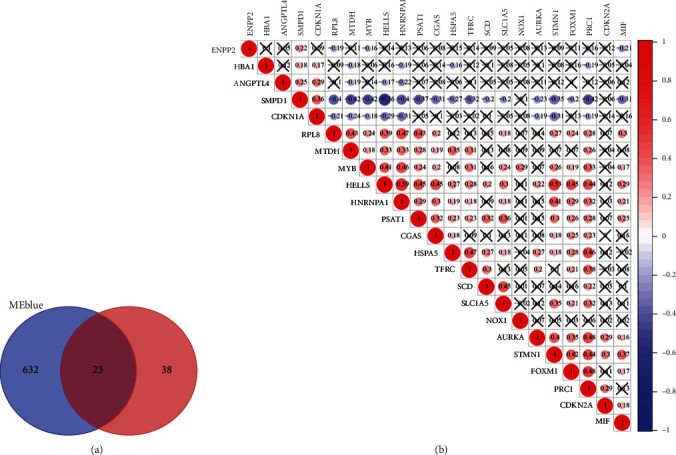
(a) Venn diagram displaying the number of genes in different groups. (b) Pearson's correlation analysis shows the relationship between the 23 FRGs based on their expression in GC tissues.

(a) Venn diagram displaying the number of genes in different groups. (b) Pearson's correlation analysis shows the relationship between the 23 FRGs based on their expression in GC tissues.