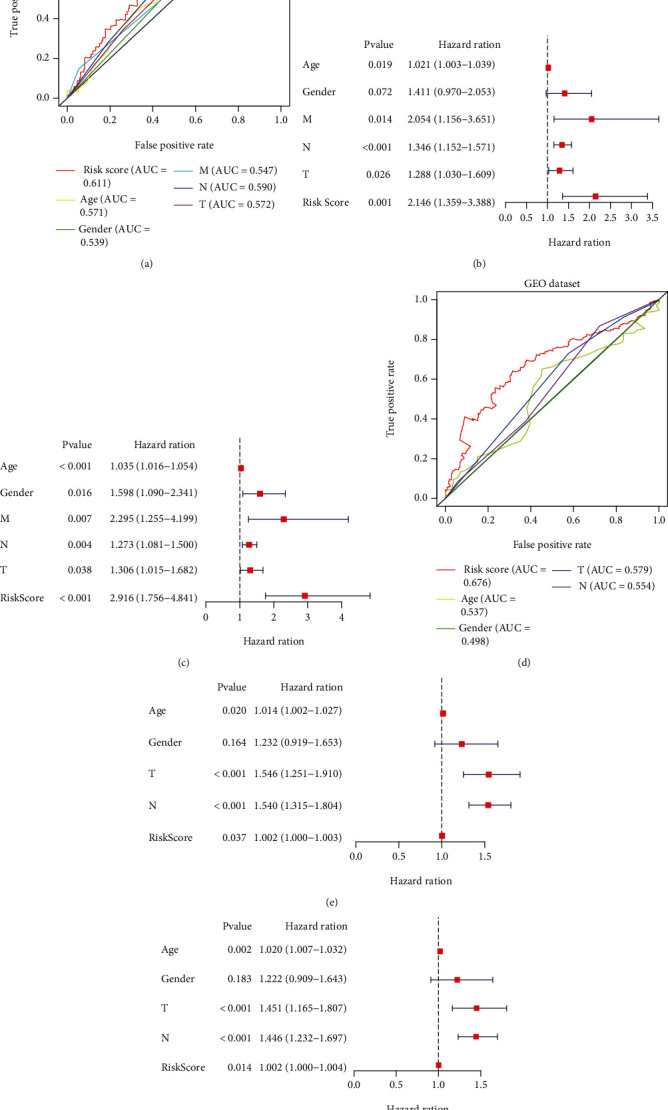
Figure 7.

Prognostic value of risk subgroups in TCGA and GEO datasets. ROC curve (a), UCR (b), and MCR (c) analyses of the risk score and other clinical indices in the TCGA cohort. ROC curve (d), UCR (e), and MCR (f) analyses of the risk score and other clinical indices in the GEO cohort.
