Figure 8.

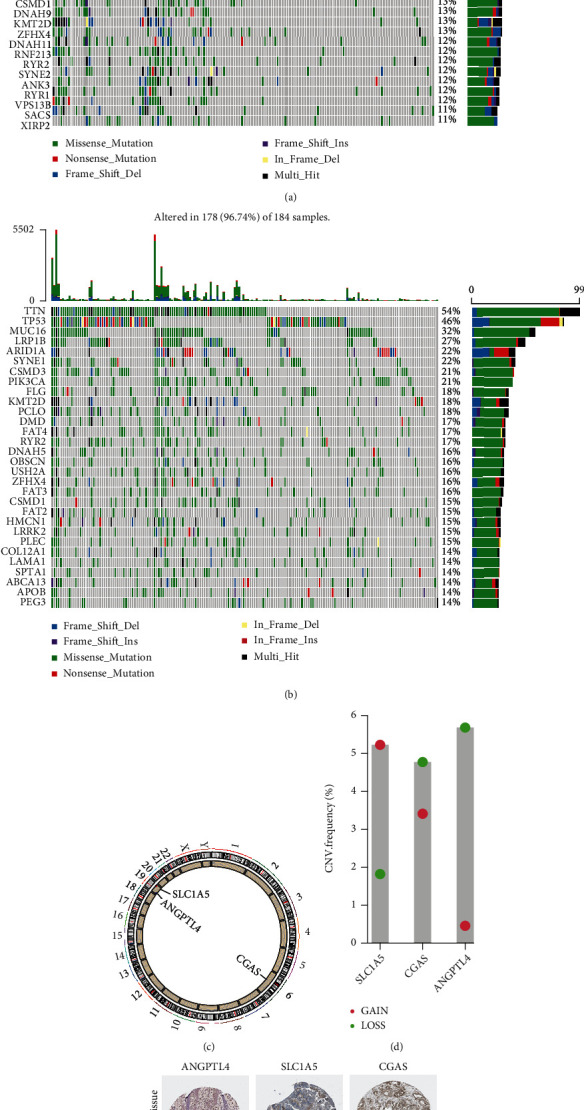
Genomic mutation profiles of different risk groups and genes. (a) Low-risk group and (b) high-risk group. The CNV mutation frequency (d) and location on chromosomes (c) of three genes. (e) The expression level of three genes in GC tissues.

Genomic mutation profiles of different risk groups and genes. (a) Low-risk group and (b) high-risk group. The CNV mutation frequency (d) and location on chromosomes (c) of three genes. (e) The expression level of three genes in GC tissues.