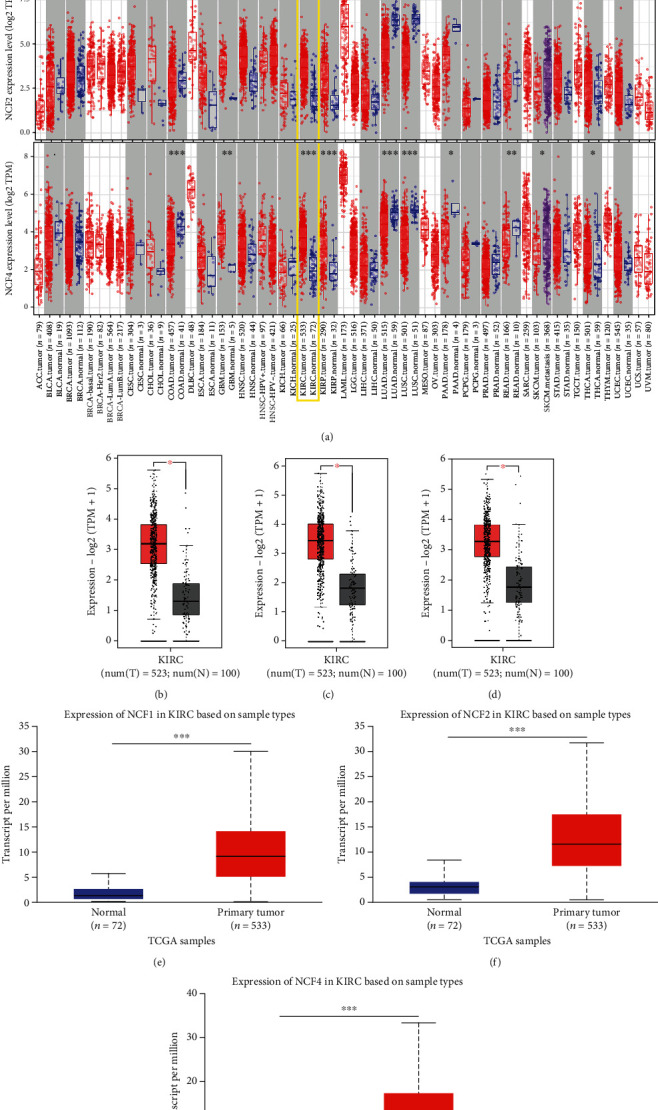
Figure 1.

The expression levels of NCF1, NCF2, and NCF4 in KIRC were higher than those in the respective adjacent normal tissues. (a) Expression levels of NCF1, NCF2, and NCF4 in different types of tumors from TCGA database were determined using TIMER 2.0. (b–d) Expression levels of NCF1, NCF2, and NCF4 in KIRC tissues compared with normal tissues using the GEPIA database. (e, f) Expression levels of NCF1, NCF2, and NCF4 were expressed as box plots in normal individuals and patients with KIRC using the UALCAN database. ∗p < 0.05, ∗∗p < 0.01, and ∗∗∗p < 0.001.
