
Figure 3.
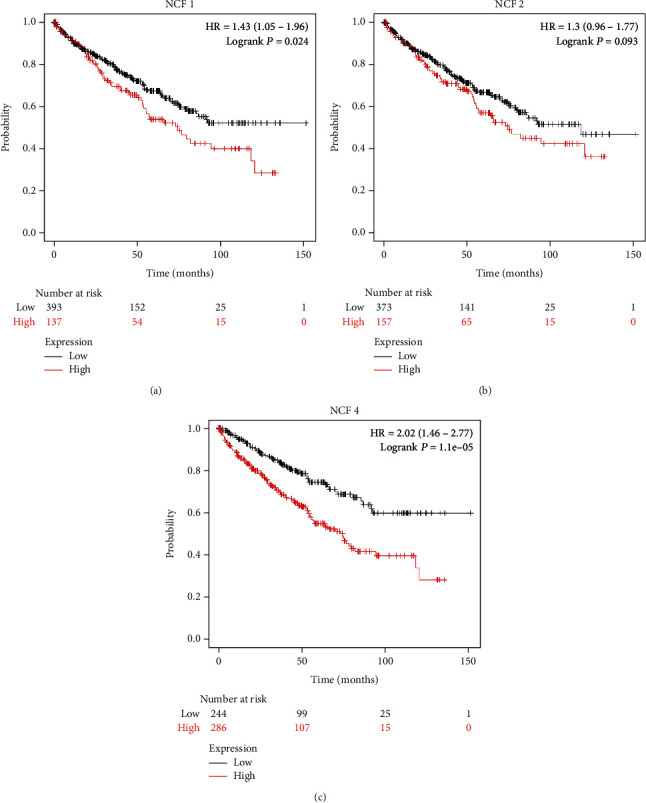
NCF1, NCF2, and NCF4 are associated with the overall survival (OS) rate in KIRC. (a–c) Kaplan–Meier survival curves comparing high- and low-expression levels of NCF1, NCF2, and NCF4 in KIRC using Kaplan–Meier Plotter database. Survival curves based on overall survival (OS).