
Figure 8.
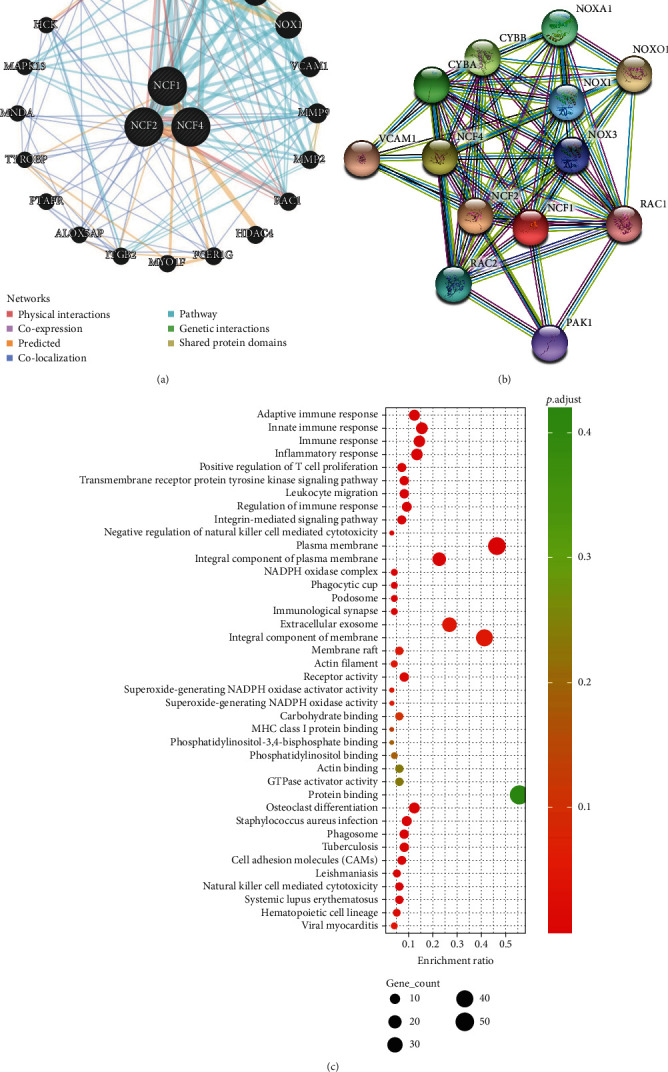
Enrichment pathway of NCFs in KIRC. (a) PPI network of NCF1, NCF2, and NCF4 (GeneMANIA). Different colors of the network edge indicate the bioinformatics methods applied: physical interactions, coexpression, predicted, colocalization, pathway, genetic interactions, and shared protein domains. (b) PPI network of NCF1, NCF2, and NCF4 (STRING). (c) Bubble diagram showed the GO enrichment in cellular component (CC) terms, biological process (BP) terms, and molecular function (MF) terms and bar plot of Kyoto Encyclopedia of Genes and Genomes (KEGG) enriched terms.