Figure 3.

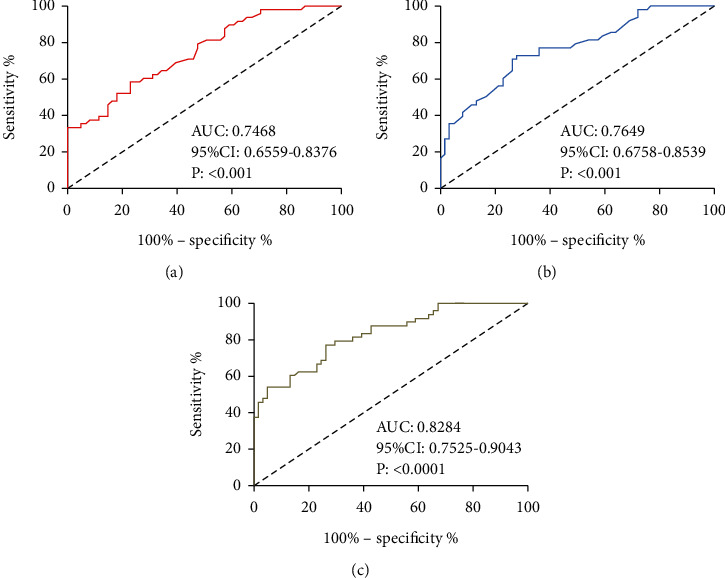
Value of Apelin and Vaspin in forecasting HT. (a) ROC curve of Apelin in forecasting HT after IT. (b) ROC curve of Vaspin in forecasting HT after IT. (c) ROC curve of Apelin combined with Vaspin in forecasting HT after IT.

Value of Apelin and Vaspin in forecasting HT. (a) ROC curve of Apelin in forecasting HT after IT. (b) ROC curve of Vaspin in forecasting HT after IT. (c) ROC curve of Apelin combined with Vaspin in forecasting HT after IT.