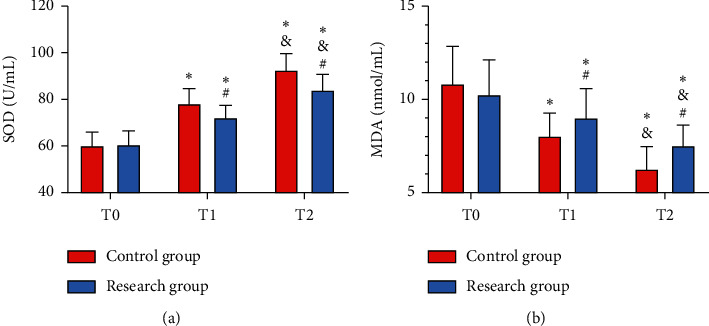
Figure 5.

Comparison of oxidative stress reaction between the two groups. (a) Comparison of SOD. (b) Comparison of MDA vs. Con group, ∗P < 0.05 vs. T1, #P < 0.05 vs. T2, and &P < 0.05.

Comparison of oxidative stress reaction between the two groups. (a) Comparison of SOD. (b) Comparison of MDA vs. Con group, ∗P < 0.05 vs. T1, #P < 0.05 vs. T2, and &P < 0.05.