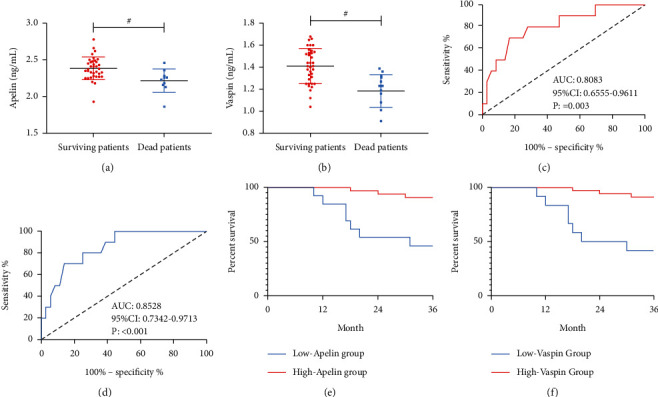
Figure 6.

Associations of Apelin and Vaspin with prognosis. (a) Comparison of Apelin between the dead patients and the surviving patients. (b) Comparison of Vaspin between the dead patients and the surviving patients. (c) ROC curve of Apelin in forecasting the death of CIS patients with HT after thrombolysis. (d) ROC curve of Vaspin in forecasting the death of CIS patients with HT after thrombolysis. (e) Survival curve of the high and low Apelin groups. (f) Survival curve of the high and low Vaspin groups. #P < 0.05.
