Figure 1.

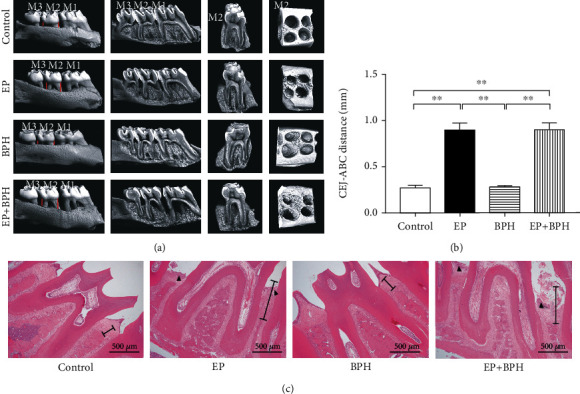
Alveolar bone loss and histological changes in rat periodontal tissues. (a) Representative images obtained by micro-CT, including the surface of the bone, the trabecular structure inside, the regain of root furcation of the second molar, and the bone surrounding the roots. The red lines showed the linear distance from the cementoenamel junction (CEJ) to the alveolar bone crest (ABC) for the maxillary second molar. (b) Quantitative analysis of the CEJ-ABC distance from the control, EP, BPH, and EP+BPH groups. Data are presented as mean ± SEM (∗∗p < 0.01). (c) Representative figures from HE staining for the second maxillary alveolar bones (arrows indicate inflammatory changes in the gingival epithelium, scale plates indicate linear distance from CEJ to ABC). Scale bar = 500 μm; original magnification ×40.
