Figure 10.

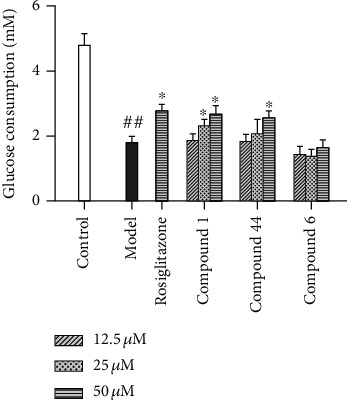
Effects on glucose consumption of the insulin-resistant HepG2 cells. Each value was presented as mean ± SD (n = 5). ∗P < 0.05 vs. the model group, ##P < 0.01 vs. the control group.

Effects on glucose consumption of the insulin-resistant HepG2 cells. Each value was presented as mean ± SD (n = 5). ∗P < 0.05 vs. the model group, ##P < 0.01 vs. the control group.