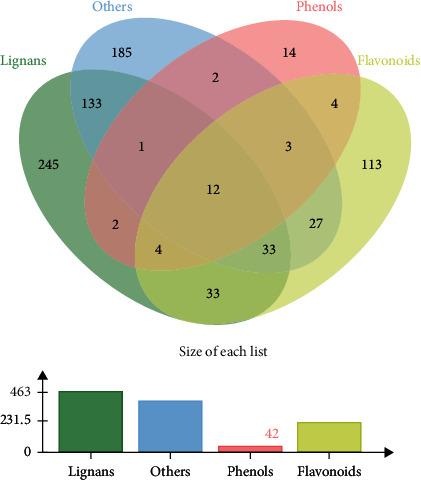
Figure 3.

The relationship between the number of candidate targets and the types of compounds of FLC. The green represents the lignans in FLC, the yellow represents the flavonoids in FLC, the red represents the phenols in FLC, and the blue represents the other compounds in FLC.
