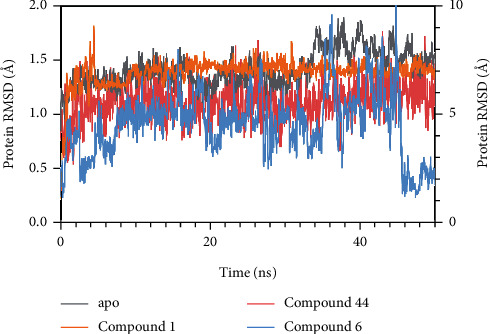
Figure 8.

The RMSD plots of PTP1B apo protein and PTP1B-the compound complex monitored during the whole molecular dynamics simulations. RMSD plots of PTP1B apo protein (grey, plot data on left Y axis), PTP1B-compound 1 complex (orange, plot data on right Y axis), PTP1B-compound 44 complex (red, plot data on left Y axis), and PTP1B-compound 6 complex (blue, plot data on right Y axis).
