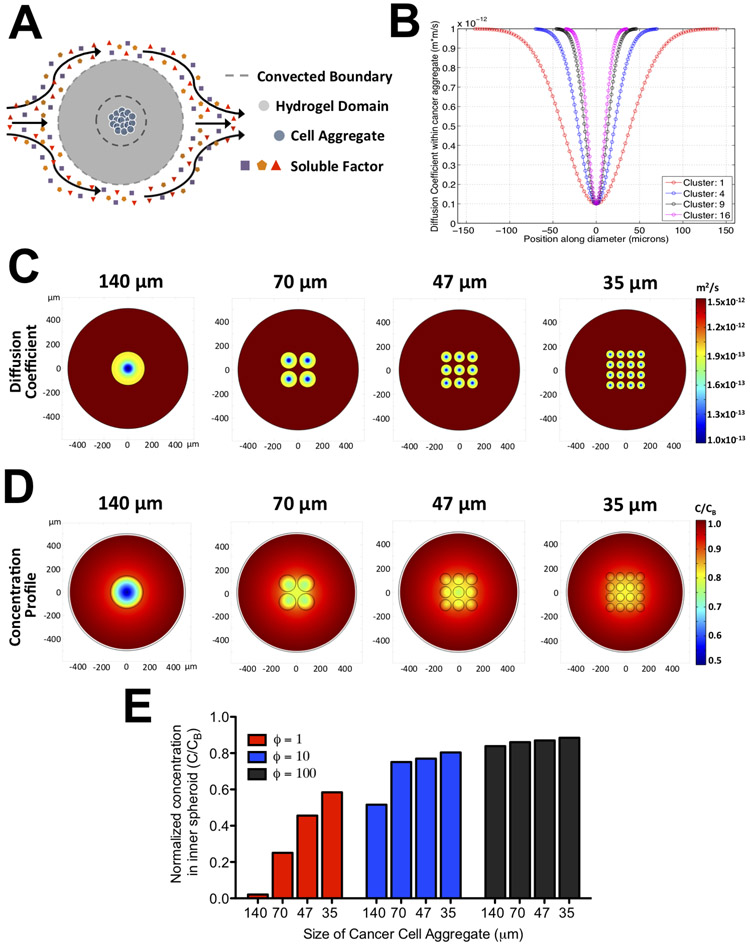
Figure 3: Mass transfer analyses of hydrogels containing cancer cell aggregates of varying sizes.
(A) Schematic of the mass transfer model illustrating the domain geometry, boundary conditions, and position of the cancer cell aggregates. (B) Profile of diffusion coefficient within a cell aggregate (D;) along its diameter for hydrogels containing different number of cell clusters. For hydrogels with 1, 4, 9, and 16 clusters, the radius of each cluster is 140, 70, 47, and 35 μm, respectively. The x-axis and y-axis denote the locations along the aggregate diameter in microns and the corresponding value of the diffusion coefficient, respectively. Heat map of the diffusion coefficient (C) and normalized concentration of solute at steady state (D) within the GelMA hydrogel containing cancer cell aggregates at specified sizes. The x- and y- axis denotes the spatial positions in microns within the hydrogel. (E) The steady state normalized concentration at the center of the innermost aggregate as a function of ϕ and aggregate size. ϕ is defined as the ratio of diffusion to consumption rate of a solute.

