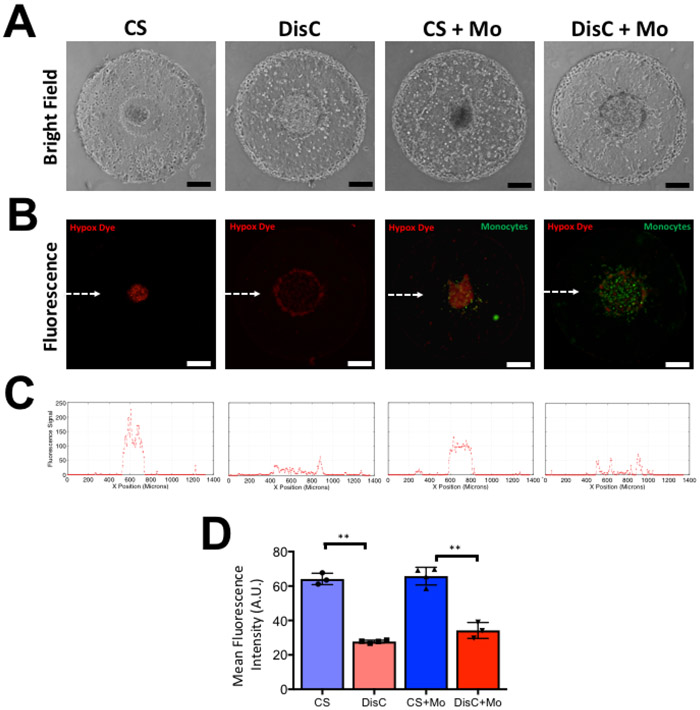
Figure 4: Culture condition-dependent hypoxia in GelMA hydrogels containing cancer cells (MCF7) and monocytes (THP-1) after 2 days of culture.
(A) Brightfield images of GelMA hydrogels containing a cancer spheroid (CS), dispersed cancer cells (DisC), cancer spheroid with monocytes (CS + Mo), and dispersed cancer cells with monocytes (DisC + Mo). (B) Fluorescent image of hypoxia detection dye within encapsulated cells. Increased intensity of red fluorescence denotes more hypoxia experienced by the cells. Monocytes within the hydrogels are labeled with green fluorescent dye. (C) Line profile of red fluorescence intensity along the midline of the fluorescent images, which is indicated by the white dashed line in the fluorescent image containing CS. (D) Mean fluorescence intensity within different cultures. Scale bar: 200 μm.

