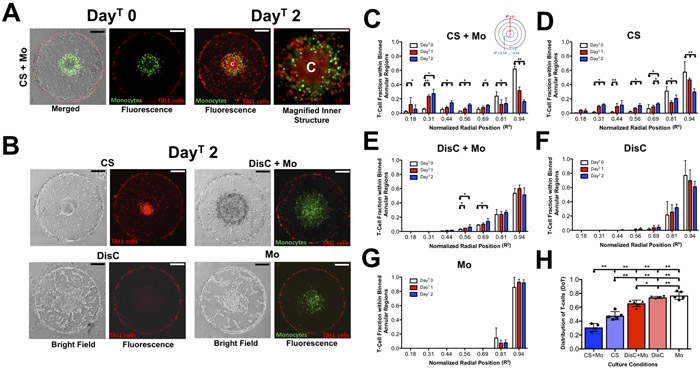
Figure 5: TALL-104 cell infiltration into bi-layer GelMA hydrogels laden with cancer cells (MCF7), monocytes (THP-1), and endothelial cells.
(A, DayT0 Panel) Merged and fluorescence images of T-cells adhered onto the periphery of a bi-layer GelMA hydrogel containing a cancer spheroid, monocytes, and endothelial cells (CS + Mo) immediately after introducing T-cells. (A, DayT 2 Panel) Fluorescence image of the cell-laden construct two days post-infiltration (DayT 2 wherein “C” designates the center of the hydrogel. Monocytes and T-cells are fluorescently labeled by green and red dyes, respectively. Scale bar: 200 μm. (B) Brightfield and fluorescence image of the bi-layer hydrogels with cancer spheroids (CS), dispersed cancer cells and monocytes (DisC + Mo), dispersed cancer cells (DisC), and monocytes (Mo) within the interior of the hydrogel at DayT 2. (C-G) Fraction of TALL-104 cells residing within each annular region, shown in the inset, from DayT 0 to DayT 2 for hydrogels containing CS + Mo, CS, DisC + Mo, DisC, and Mo. The normalized radial position denotes the radial midpoint location in each annulus. The sample sizes for CS+Mo, CS, DisC+Mo, DisC, and Mo are 4, 5, 5, 4, and 5, respectively. (H) Quantification of the Distribution of T-cells (DoT) within the bi-layer hydrogels for different cultures. Lower and higher DoT values indicate the distribution of T-cells towards the center and periphery, respectively.

