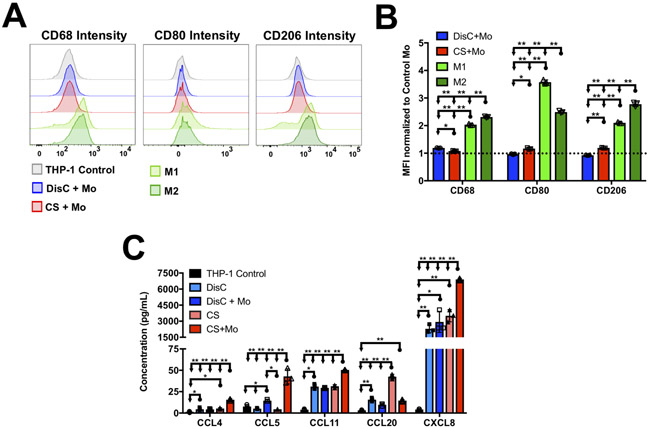
Figure 6: Culture condition dependent chemokine secretion and changes in THP-1 phenotypes.
(A) FACS analysis of THP-1 monocytes from different cultures showing representatives intensity histograms for CD68, CD80, and CD206. M1 and M2 within the legends indicate THP-1 cells differentiated into either M1 or M2 macrophages. (B) Mean fluorescence intensity (MFI) of CD68, CD80, and CD206 normalized to MFI of these markers of THP-1 monoculture. (C) Chemokines of different cultures containing MCF7 cells and THP-1 monocytes.

