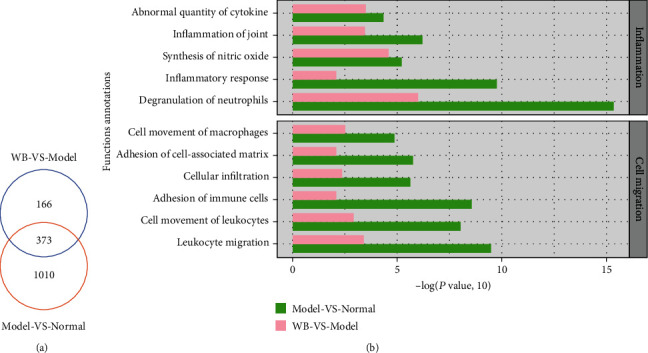
Figure 4.

The biofunction analysis of DEPs in WB vs. model and model vs. normal. (a) The Venn diagram of DEPs of WB vs. model and model vs. normal. (b) The top function enrichment annotations in inflammation and cell migration were screened with −log(P value, 10) ≥ 1.3.
