
Figure 6.
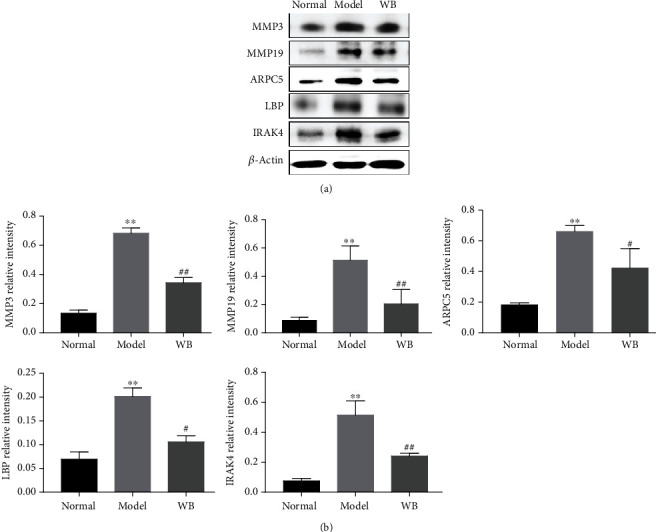
The validation of DEPs. (a) Representative bands of western blot in different groups. (b) Semiquantitative analysis of western blot in different groups. Data were mean ± SD, n = 3. ∗∗P < 0.01 compared with the normal group; ##P < 0.01 and #P < 0.05 compared with the model group.