
Fig. 3.
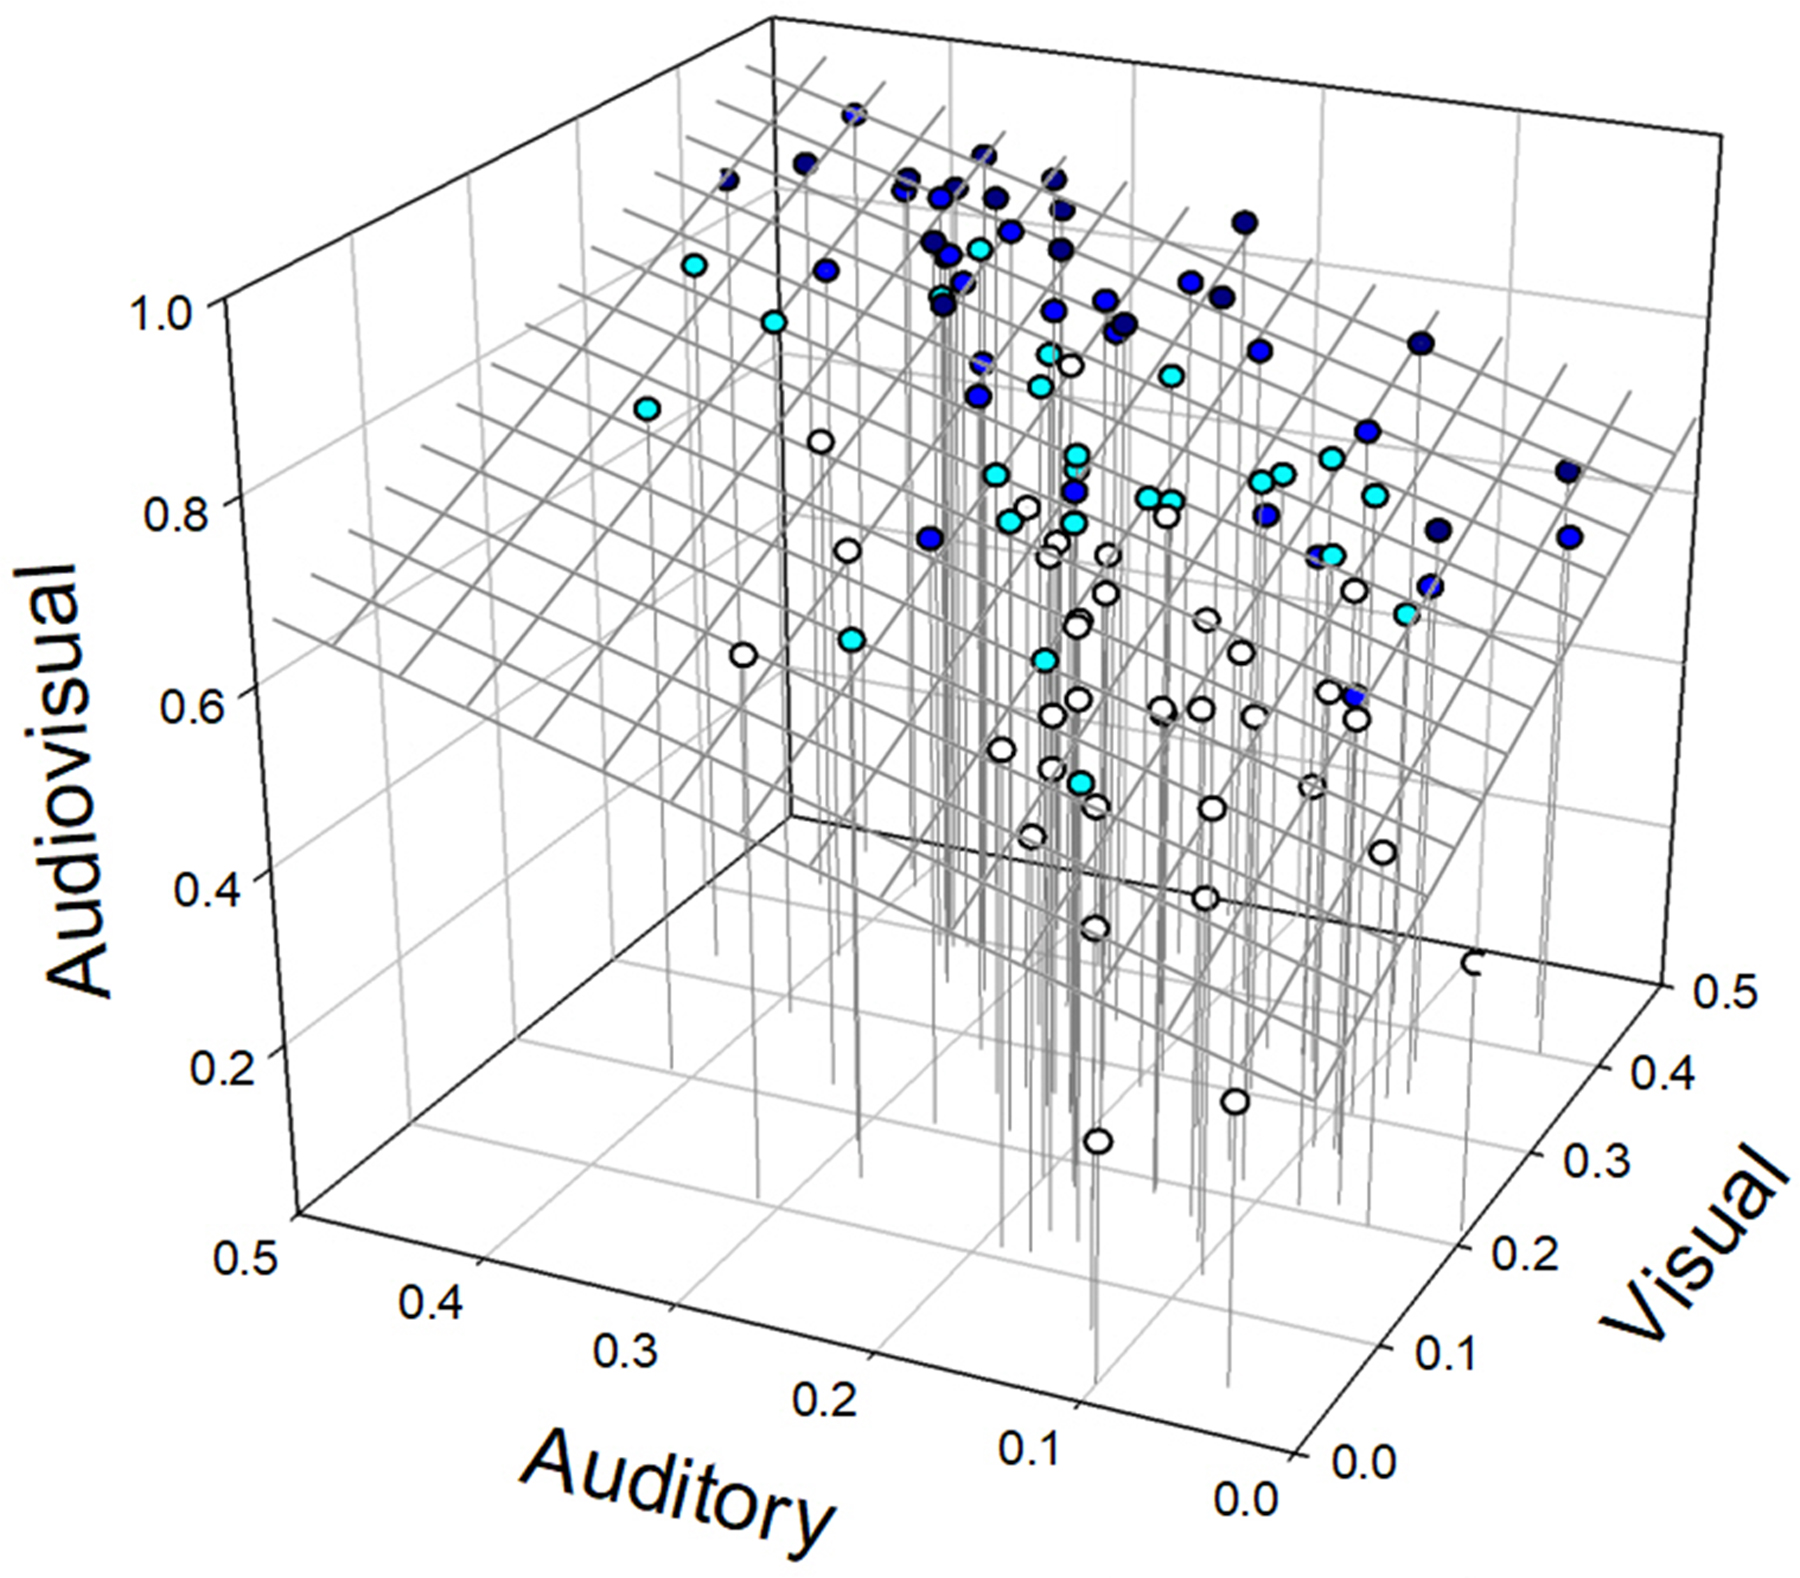
Results of multiple linear regression analysis. The figure depicts each participant’s accuracy in the audiovisual condition as a function of accuracy in the auditory and visual conditions; the color of each participant’s data point indicates their age group (see legend). The plane representing the predictions of the best-fitting reduced (i.e., without an age term) linear regression model, AV = b0 + b1*A + b2*V, is also shown, as well as drop lines from the data points to the surface AV=A=V=0.0 for comparison purposes.