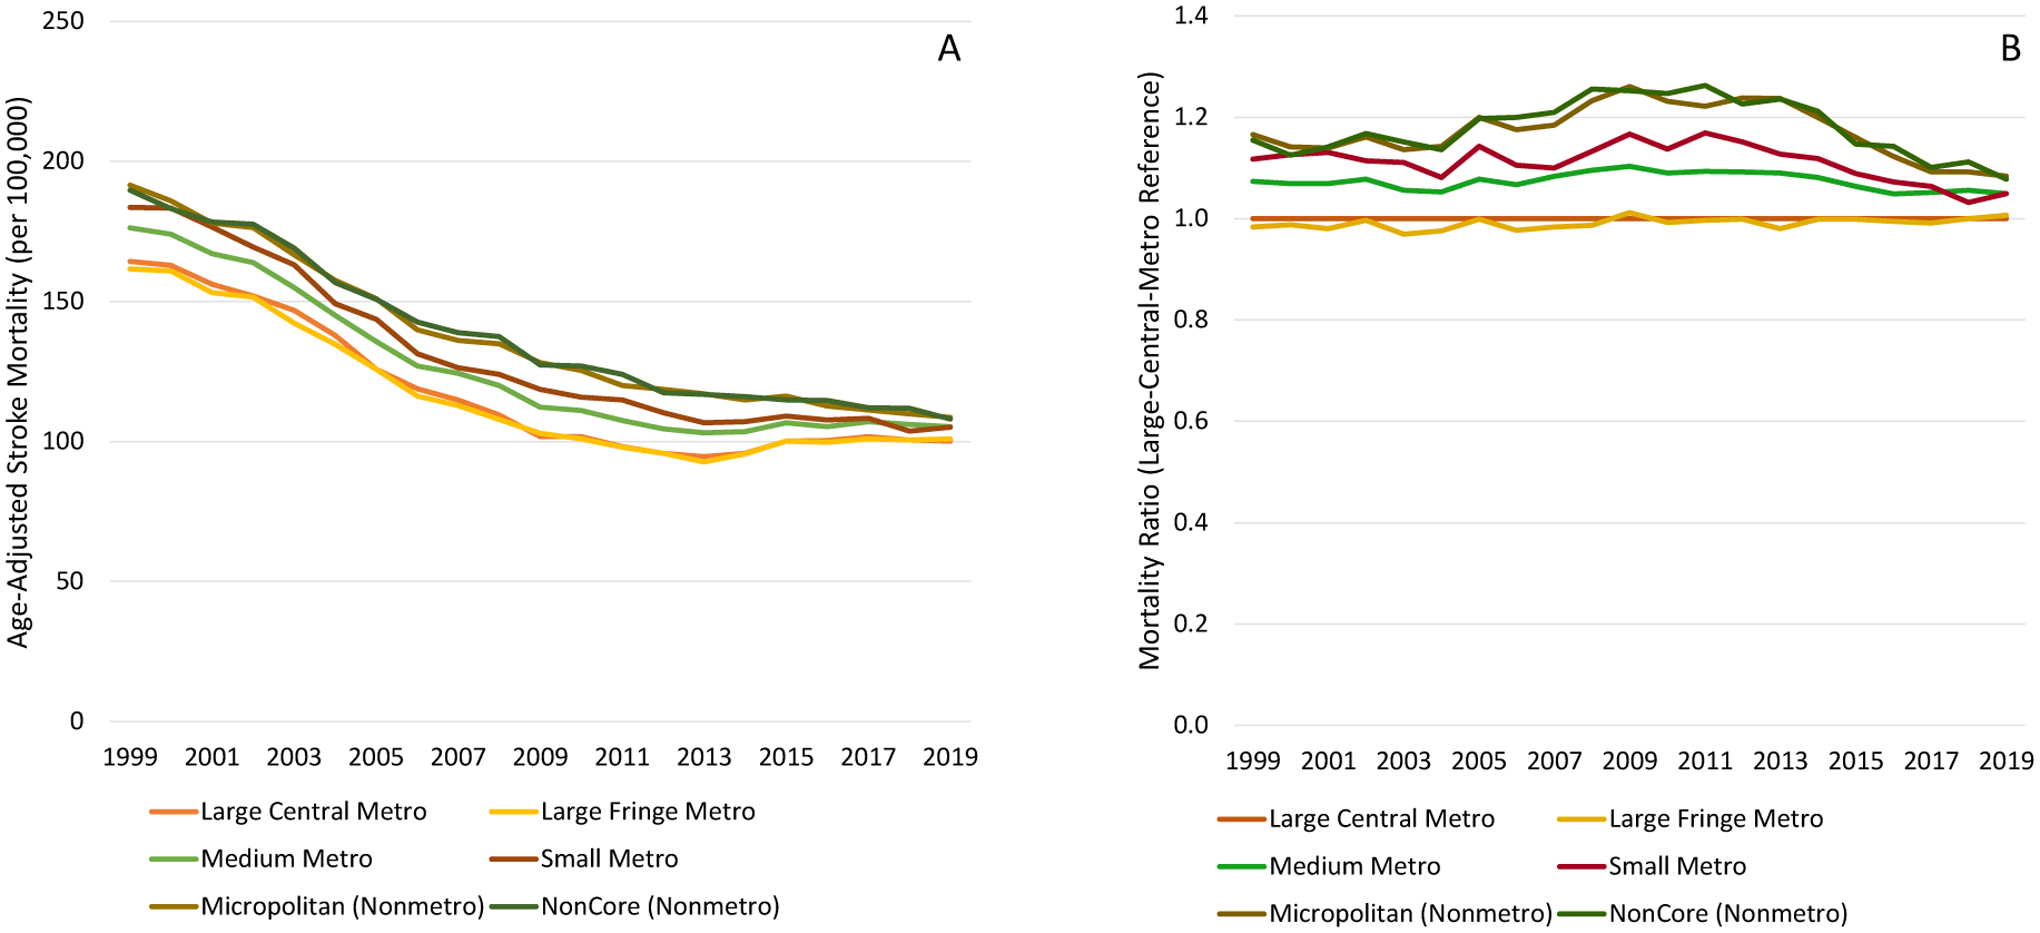
Figure 2:

Temporal changes in age-adjusted stroke mortality (ICD-10 I60 to I69) for ages 45 and over between 1999 and 2019, shown by the 2013 NCHS Urban-Rural Classification Scheme (panel C), and mortality ratio relative to residents of in large-central-metro counties (panel D). Source CDC WONDER.
