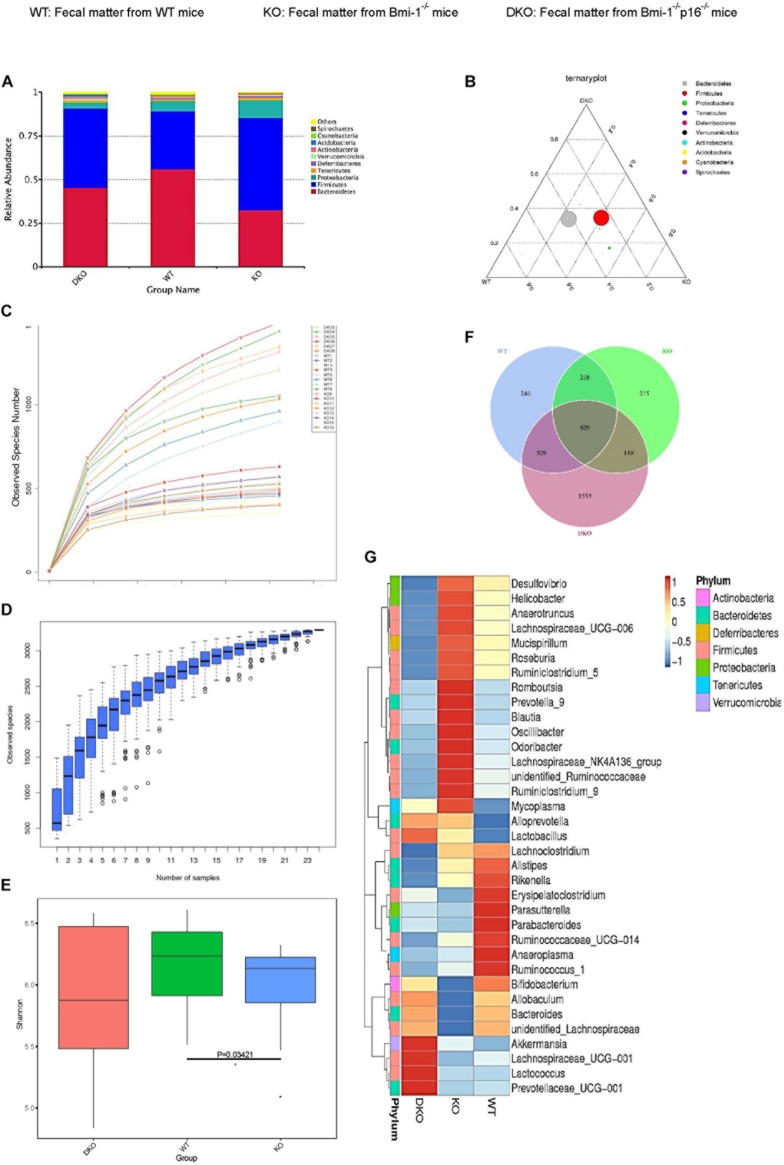
FIGURE 7.
P16 deletion improved intestinal microbial dysbiosis in Bmi-1–/– mice. High-throughput sequencing of V4 region amplicon of 16S rRNA from intestinal microbiota was conducted using the fecal of 7-week-old WT, Bmi-1–/– (KO), and Bmi-1–/–p16–/– (DKO) mice. (A) Principal components at the phylum level in the intestinal microbiota of WT, Bmi-1–/–, and Bmi-1–/–p16–/– mice. Relative contribution of the top 10 phylum of each sample was shown; “others” represents the sum of abundance except the top 10 phylum, n = 8. (B) Proportion of intestinal microbiota in 7-week-old WT, KO, and DKO mice at the phylum level. Circle represents a taxonomy at the level of phylum; the size of the circle represents the abundance of the microbiota at the phylum level. (C) Abundance display curve of intestinal microbiota in WT, KO, and DKO mice. Abscissa represents sequencing depth; ordinate represents the number of species found. (D) Box plot showing abundance dilution. The end of the curve is close to gentle, indicating that the sample size of sequencing meets the requirements of diversity. (E) The observed species number and α-diversity index of intestinal bacteria were examined. Significant differences are indicated: Wilcoxon rank sum test, n = 8 per group, *p < 0.05, compared with the WT group. (F) Venn diagrams demonstrate the number of species shared among WT, KO, and DKO groups. (G) Heat map showing distribution of intestinal microbiota at genus level from 7-week-old WT, Bmi-1–/–, and Bmi-1–/–p16–/– mice; the phylum of each genus is listed in the note, n = 8. The heat map is colored based on row Z scores. The mice with the highest and lowest bacterial levels are in red and blue, respectively.

