
FIGURE 1.
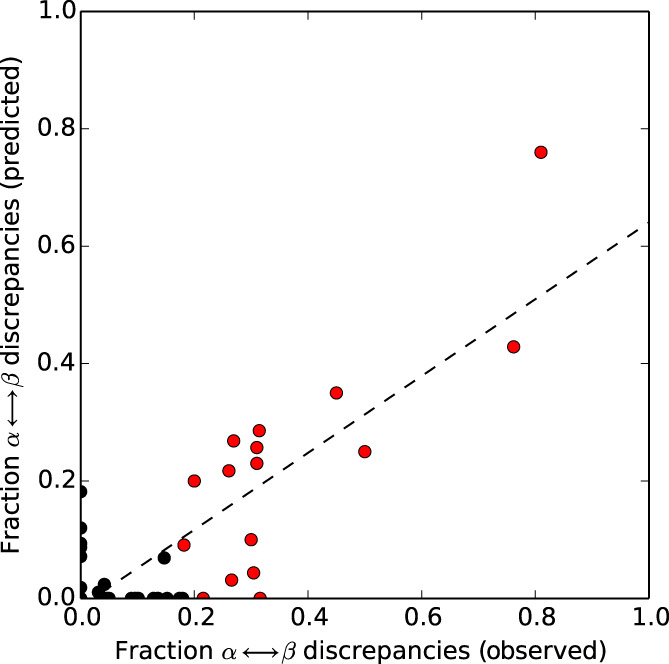
Helix ↔ strand discrepancies predicted by JPred4 correspond to experimentally observed α‐helix ↔ β‐strand differences in fold‐switching regions. Dotted line represents best linear fit of all datapoints (black and red circles; Pearson correlation: .82). Red circles correspond to benchmark set of 17‐fold switchers. Only 16 can be observed because two KaiB variants (4KSO and 1WWJ) overlap exactly at (0.31, 0.26)