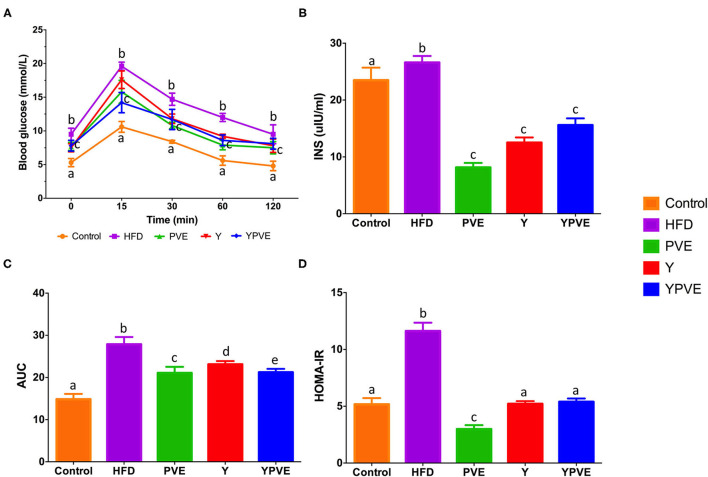
Figure 2.
The oral glucose tolerance test (OGTT) (A), AUC (B), insulin concentration (C), and HOMA-IR (D) in C57BL/6J mice fed with chow or high-fat diets for 8 weeks. Control: mice fed with a standard chow diet; HFD: mice fed with a high-fat diet; Y, mice fed with a high-fat diet with supplementation of yogurt; PVE: mice fed with a high-fat diet with supplementation of PVE. YPVE: mice fed with a high-fat diet with supplementation of PVE added yogurt. Values are presented as mean ± SEM, n = 8–12. Data not sharing a common superscript differ significantly among groups (p < 0.05) according to Duncan's post-hoc tests.

