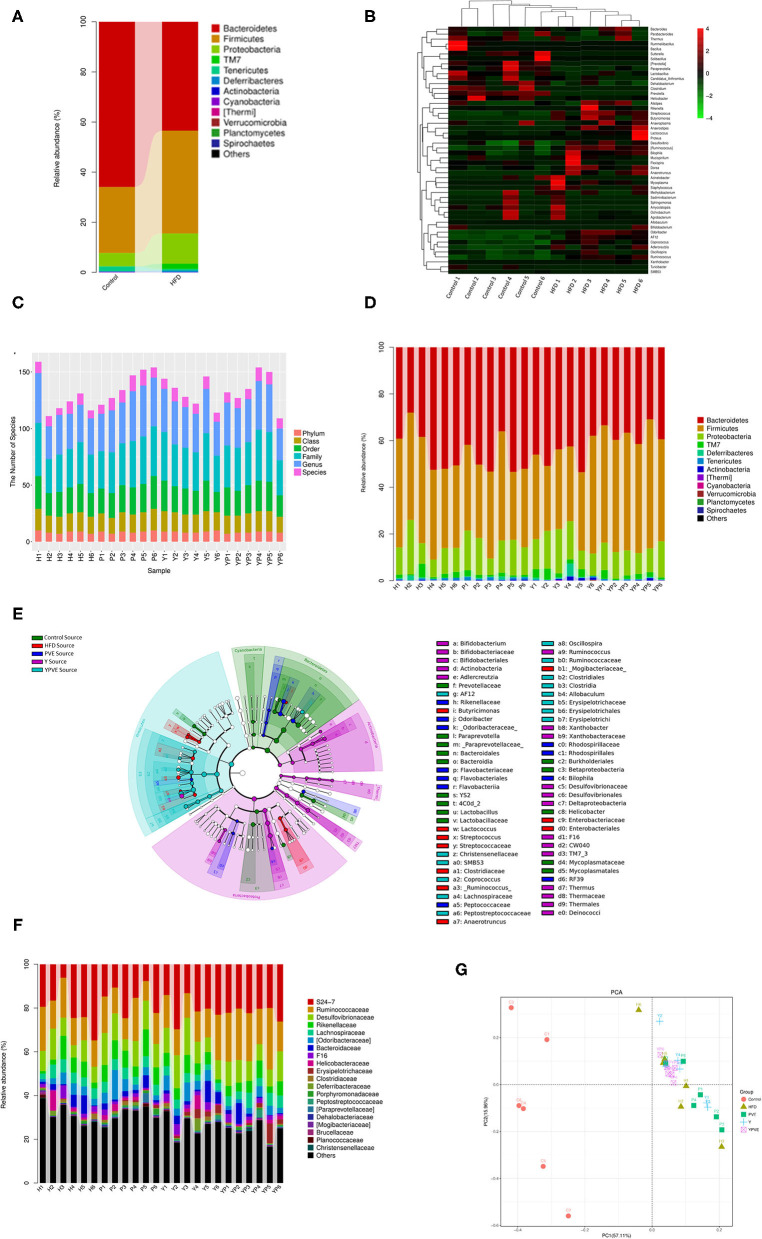
Figure 5.
The diversity analysis of microbial composition of all sample groups. Control: mice fed with a standard chow diet; H/HFD: mice fed with a high-fat diet; Y: mice fed with a high-fat diet with supplementation of yogurt; P/PVE: mice fed with a high-fat diet with supplementation of PVE. YP/YPVE: mice fed high-fat diet with supplementation of PVE added yogurt. Values are presented as mean ± SEM, n = 12. (A) Stacked percent barchart of microbial population at phylum level in control and HFD groups. Bacteroidetes were decreased rapidly in HFD group comparing with control group. (B) Heatmap of combination cluster analysis of microbial composition in genus level. Red represents higher abundance, while green represents lower abundance. Most of the increased bacteria in HFD group were harmful, including pathogenicity bacteria Streptococcus and Proteus, while, probiotics such as Prevotella, Lactobacillus and Bacillus reduced in HFD samples. (C) Stacked percent barchart of microbiota at different classification levels in different intervention groups. The diversities of intestinal microbial species in each group were generally no significant different. (D) Stacked percent barchart of microbiota at genus level in different intervention groups. The percentage of Firmicutes in YPVE group was higher than that in HFD group. While, comparing with other groups, the percentage of Bacteroides and Proteobacteria in YPVE group decreased. (E) Bacteria classification hierarchy tree based on mouse group differences displayed by cladogram. The most significantly changed bacteria were appeared in Clostridia and Bacteroidetes, such as Coprococcus, Allobaculum, Oscillospira, and AF12. (F) Stacked percent barchart of microbiota at genus level in different intervention groups. (G) two-dimensional sorting diagram of samples for PCA. Each point represents a sample, and different color belongs to different groups. The closer the distance between two points, the higher the similarity of microbial communities between the two samples, the smaller the differences. The samples in YPVE group were approaching into the same quadrant, which is much closer than the rest of groups.

