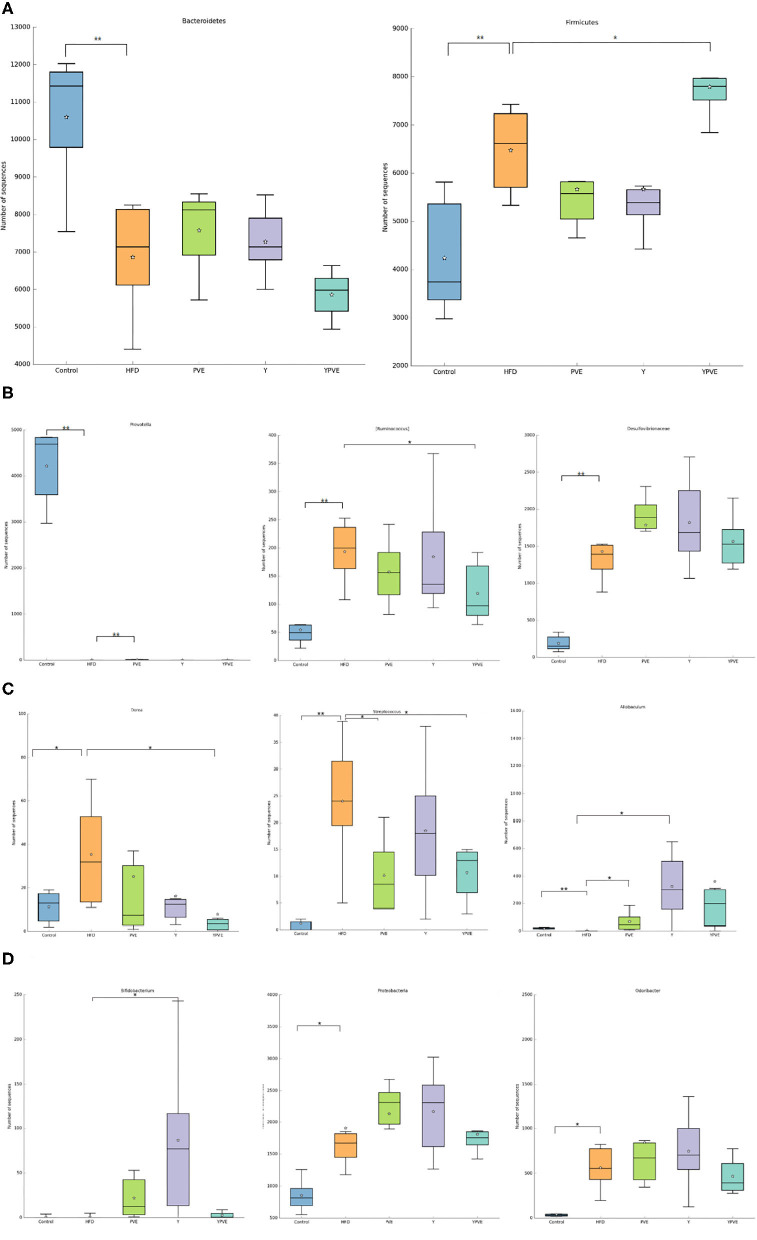
Figure 6.
The abundance of specific bacteria in HFD, Y, PVE, and YPVE groups. HFD: mice fed with a high-fat diet; Y: mice fed with a high-fat diet with supplementation of yogurt; PVE: mice fed with a high-fat diet with supplementation of PVE. YPVE: mice fed high-fat diet with supplementation of PVE added yogurt. Values are presented as mean ± SEM, n = 12. (A) Abundance of Bacteroides (left) and Firmicutes (right) in four sample groups at phylum. Y and PVE supplement the abundance of Bacteroides. However, YPVE reduce the abundance and proportion of Bacteroides. In the right panel, YPVE increased the abundance of Firmicutes, contrary to the other two groups (Y and PVE). (B) Abundances of Prevotella (left), Ruminococcus (middle), and Desulfovibrionaceae (right) in each group at the genus level. PVE group increased the abundance of Prevotella in a small amount compared with HFD group, but the other two groups were not able to supplement Prevotella. YPVE group reduced Ruminococcus. The three intervention groups had no significant effect on the genus and family of Desulfovibrionaceae. (C) Abundance of Dorea (left), Streptococcus (middle), and Allobaculum (right) in each group. The intervention YPVE reduced the increase of Dorea and Streptococcus compared with HFD group. PVE reduced the increase of Streptococcus by HFD. All three intervention groups increased the abundance of Allobaculum. (D) Abundance of Bifidobacterium (left), Proteobacteria (middle), and Odoribacter (right) in each group. Y group increased the abundance of Proteobacteria. Difference between groups was assessed using one-way ANOVA followed by Duncan's post-hoc tests: *p < 0.05, **p < 0.01.

