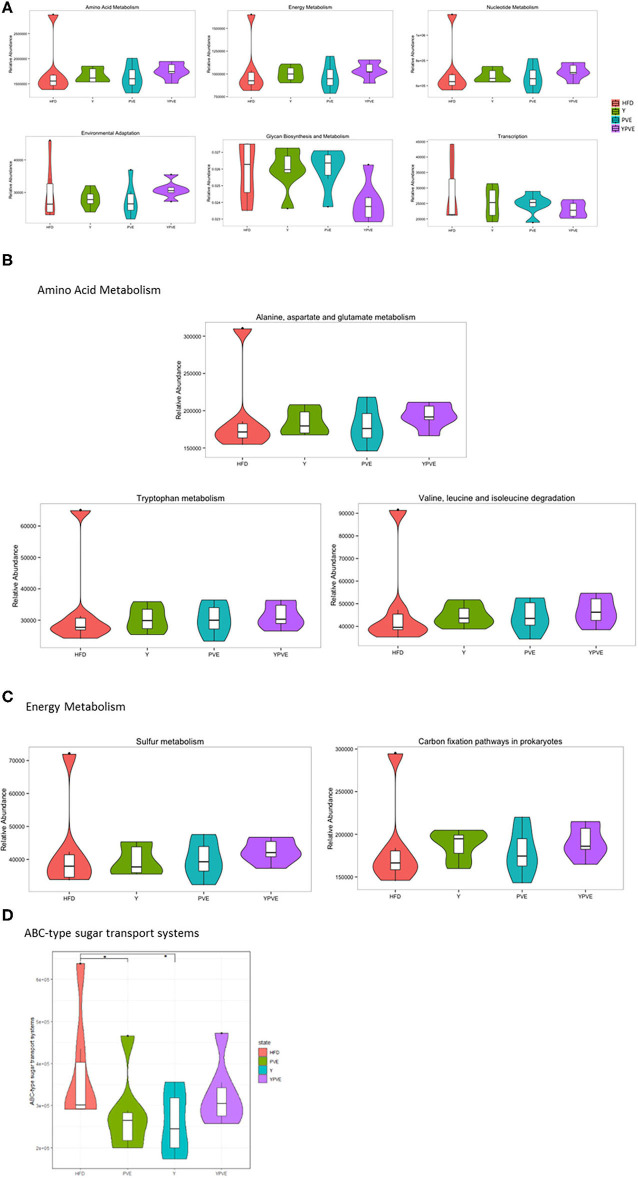
Figure 7.
Comparative analysis of functional relative abundance of intestinal flora in different mice groups. Control: mice fed with a standard chow diet; HFD: mice fed with a high-fat diet; Y: mice fed with a high-fat diet with supplementation of yogurt; PVE: mice fed with a high-fat diet with supplementation of PVE. YPVE: mice fed high-fat diet with supplementation of PVE added yogurt. Values are presented as mean ± SEM, n = 12. (A) The top six bacterial functional catalogs that vary between groups. (B) The sub-functions in Amino Acid Metabolism pathway that differ between groups. (C) The sub-functions in Energy Metabolism pathway that differ between groups. (D) The functional abundance of a sub-function “ABC-type sugar transport systems” increased significantly in PVE and Y groups compared with HFD. Significance was assessed using one-way ANOVA followed by Duncan's post-hoc tests: *p < 0.05.

