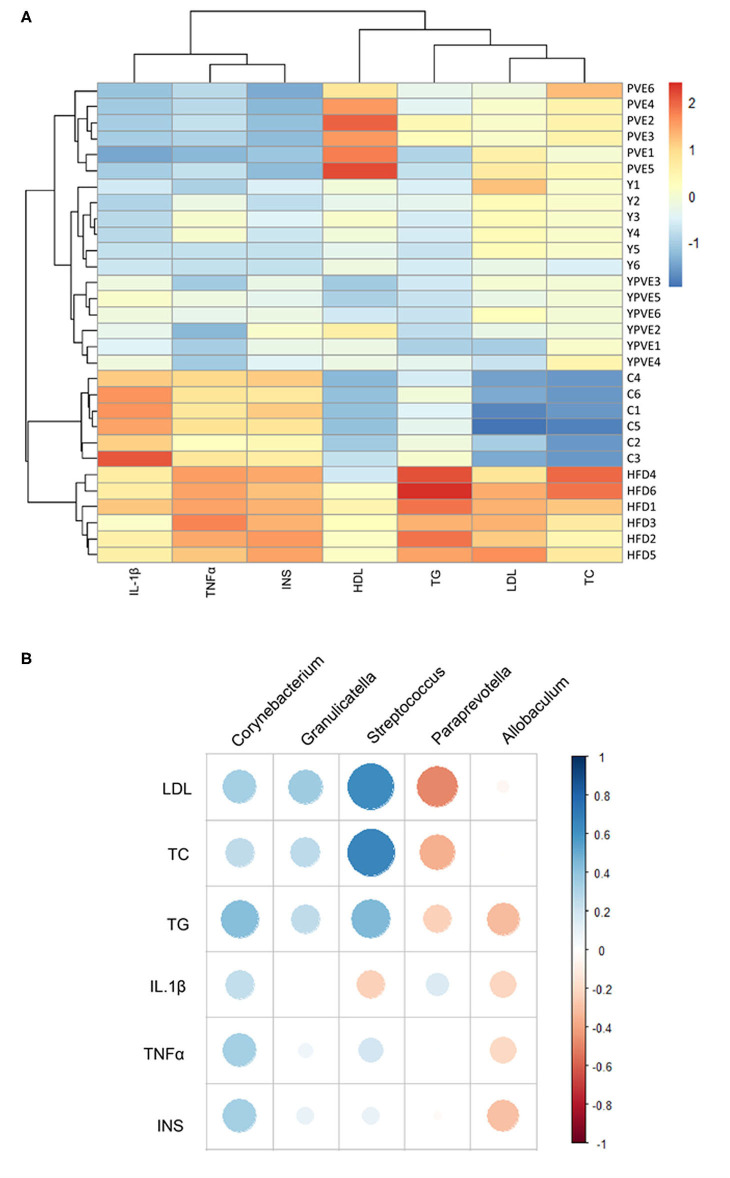
Figure 8.
The clustering for all sample groups and correlation analysis between intestinal flora and physiological indictors. Control: mice fed with a standard chow diet; HFD: mice fed with a high-fat diet; Y: mice fed with a high-fat diet with supplementation of yogurt; PVE: mice fed with a high-fat diet with supplementation of PVE. YPVE: mice fed high-fat diet with supplementation of PVE added yogurt. Values are presented as mean ± SEM, n = 12. (A) The clustering result for all samples based on all of the blood indictors, including IL1β, TNFα, INS, HDL, TG, LDL, and TC. (B) A correlation analysis between intestinal flora and physiological indictors using different groups. All of the intestinal bacteria in the groups of this chart were compared with those in control groups first. Orange represents positive correlation, while blue represents negative correlation.

