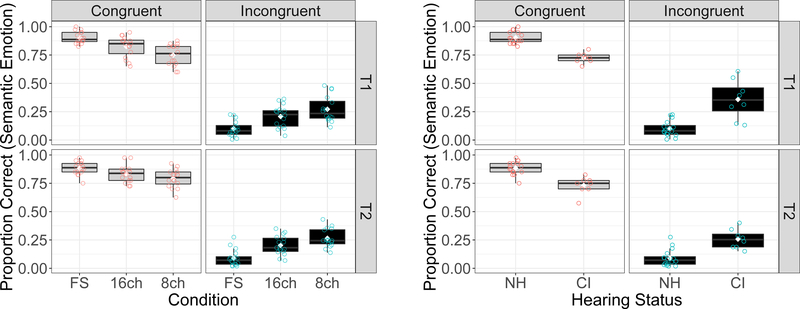
Figure 5.
A Similar to 3A, but with results averaged across semantic emotion categories. Left and right panels show Congruent and Incongruent conditions (grey and black boxplots respectively).
Figure 5B. Results with NH and CI data in the full-spectrum condition averaged across the semantic emotion categories in the Congruent (left panel) and Incongruent (right panel) conditions (light grey and black boxplots respectively).

