Figure 7.
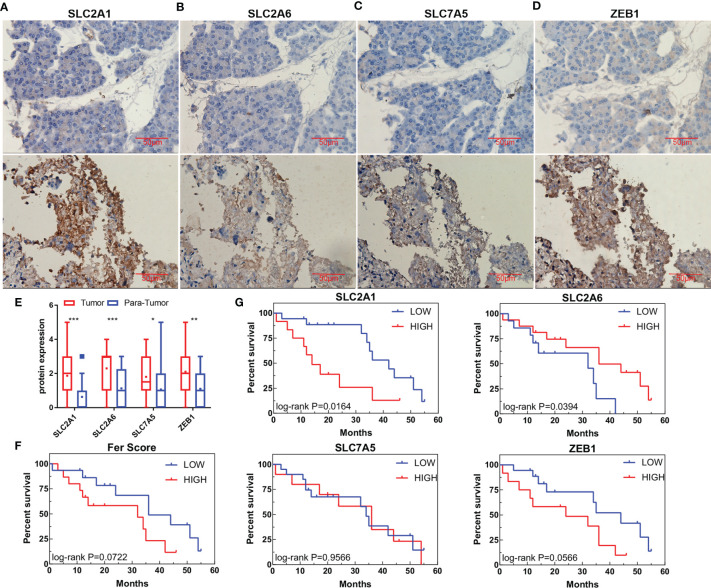
Protein expression and survival according to genes in the Fer-score model. (A–D) The expression of SLC2A1, SLC2A6, SLC7A5, and ZEB1 in adjacent tissues (top panel) and tumor tissues (bottom panel). (E) Statistical graphs of adjacent tissues and tumor expression. (Bar, 50 μm) (F) Survival curve based on the Fer-score model. (G) Survival curve according to the protein expression of the four genes. *p < 0.05, **p < 0.01, ***p < 0.001.

