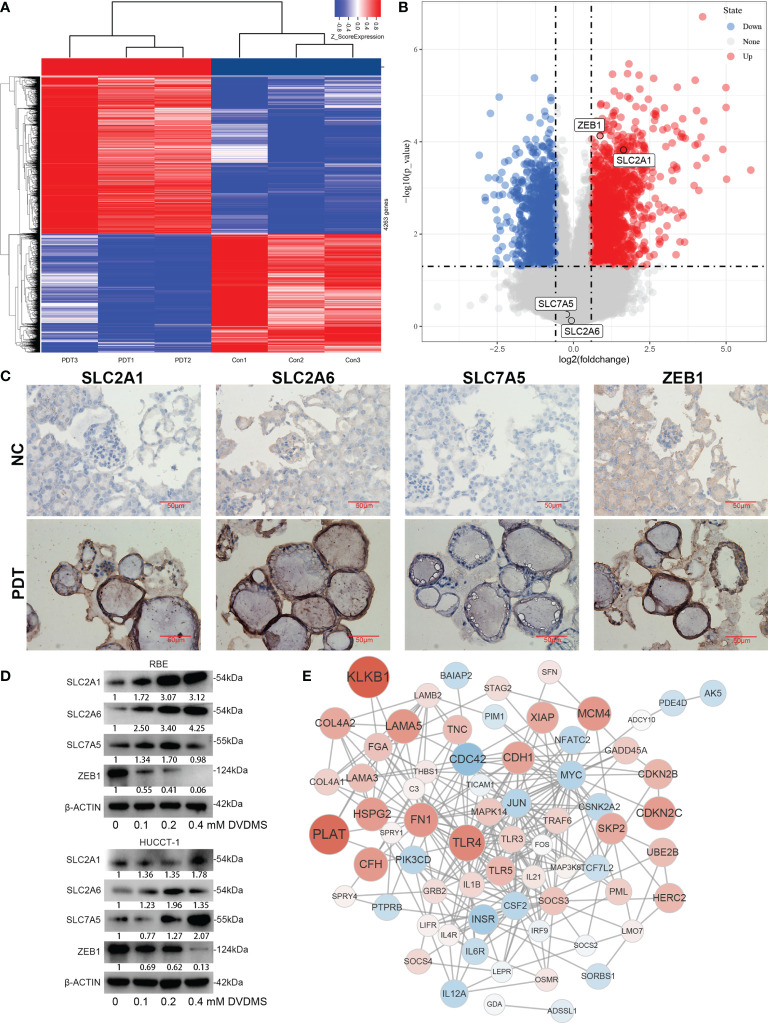
Figure 9.
Expression changes and network analysis of Fer-score model genes in PDT. (A, B) The heatmap and volcano plot show the changes of genes after PDT treatment of RBE cells. Among them, red represents upregulation of gene expression, and blue represents downregulation of gene expression. (C) Protein expression changes in organoids of CCA after PDT treatment. (D) Protein expression changes in RBE and HUCCT-1 cells after PDT treatment (bar, 50 μm). (E) Construction of the gene network based on microarray data.

