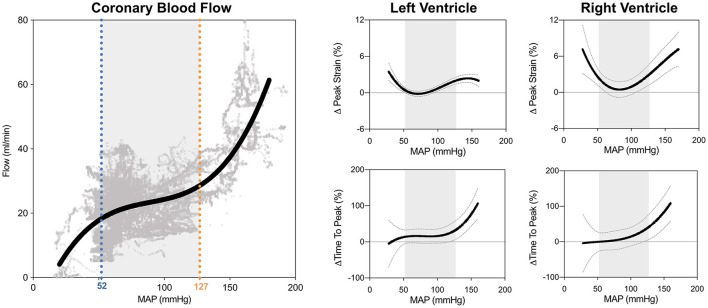
Figure 2.
Biventricular systolic strain measures in relation to blood pressure. The limits of the coronary autoregulation zone (ARZ) as calculated from invasive flow measurements are shown on the left. Non-linear relationships and 95% confidence intervals of the fit are shown between mean arterial blood pressure (MAP) and peak circumferential strain and time to peak strain for the left ventricle (middle) and right ventricle (right). Gray shading depicts the ARZ.

