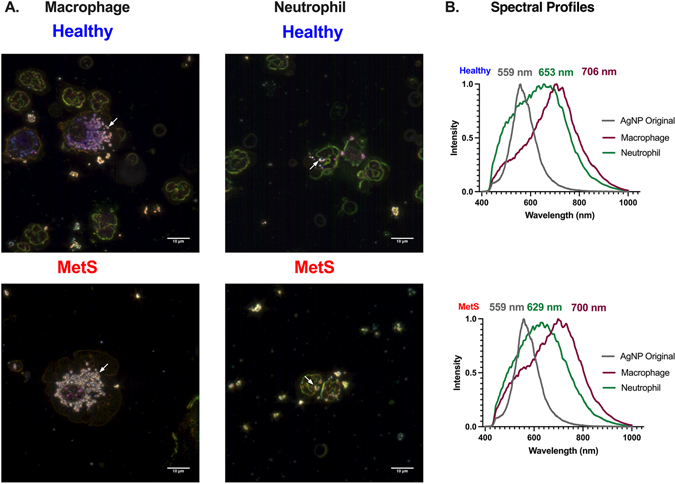
Fig. 3.
Hyperspectral analysis of AgNPs within macrophages and neutrophils collected from BALF exposed healthy and MetS mouse models. (A) Representative enhanced darkfield images of macrophages and neutrophils 24 h post-exposure to AgNPs at a concentration of 50 μg. White arrows indicate the accumulation of AgNPs within BALF cells. White bar identifies 10 μm scaling. (B) Differences in mean spectra of AgNPs following association with BALF cells. At least 1,000 pixels of AgNPs were collected to form mean spectra. All spectra were normalized based on intensity for comparisons. Gray curve is the spectral profile of the original AgNP sample, the green curve represents AgNPs internalized by neutrophils, and the purple curve represents AgNPs internalized by macrophages. Numbers correspond to peak wavelengths. The top set of curves represent spectra of AgNPs internalized by BALF cells in the healthy model while the bottom set of curves represent spectra of AgNPs internalized by BALF cells in the MetS model. Supplemental Figure 1 includes representative image of original AgNPs as well as mapping results confirming curves represent internalized AgNPs. Representative images of internalized cells and spectral profiles of internalized AgNPs from groups receiving lipid treatments can be found in Supplemental Figure 2 (14-HDHA), Supplemental Figure 3 (17-HDHA), and Supplemental Figure 4 (18-HEPE).

