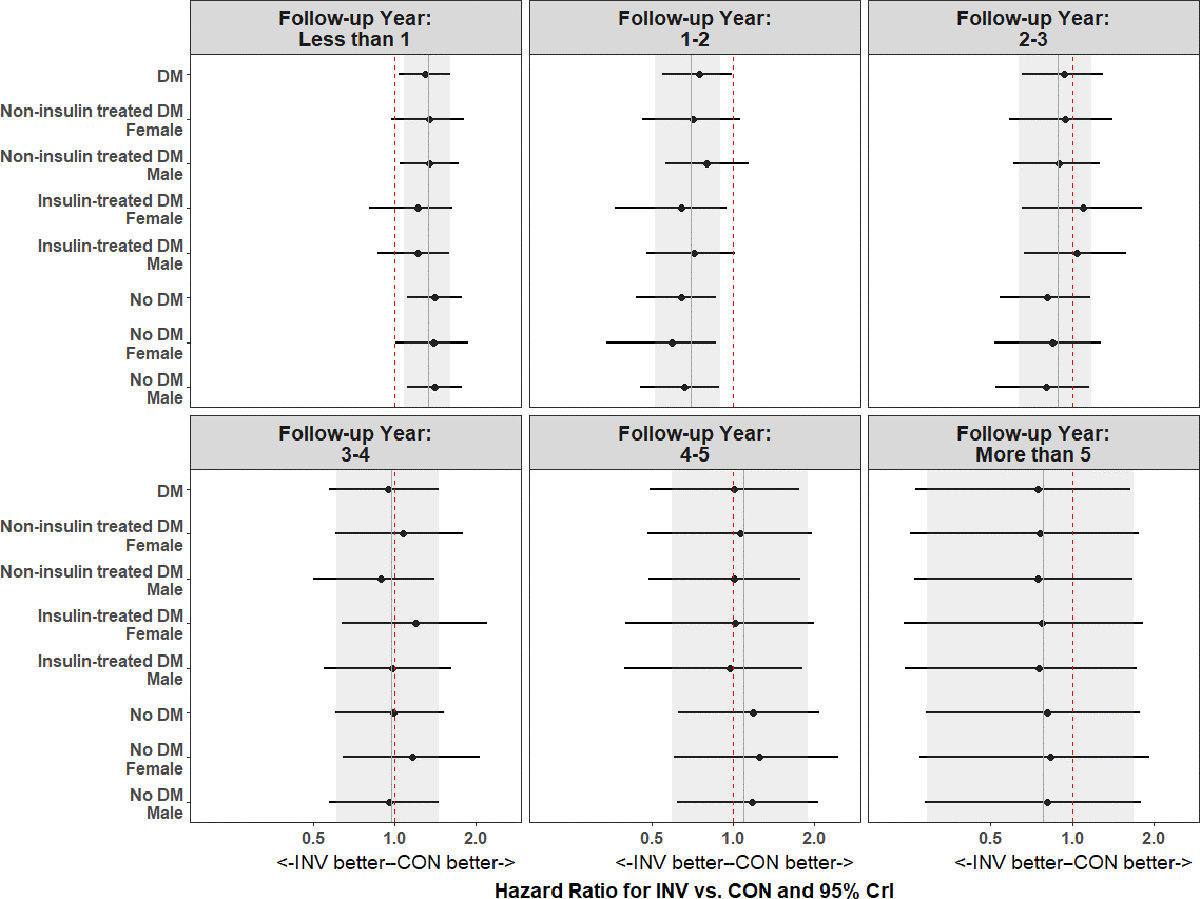
Figure 4. Diabetes and clinical feature-specific treatment effects over each year of study follow-up. Vertical gray bar is the overall treatment effect and the associated gray shading corresponds to the 95% credible interval. Vertical dashed red bar is at 1 for the null value.

Abbreviations: CrI, credible interval.
