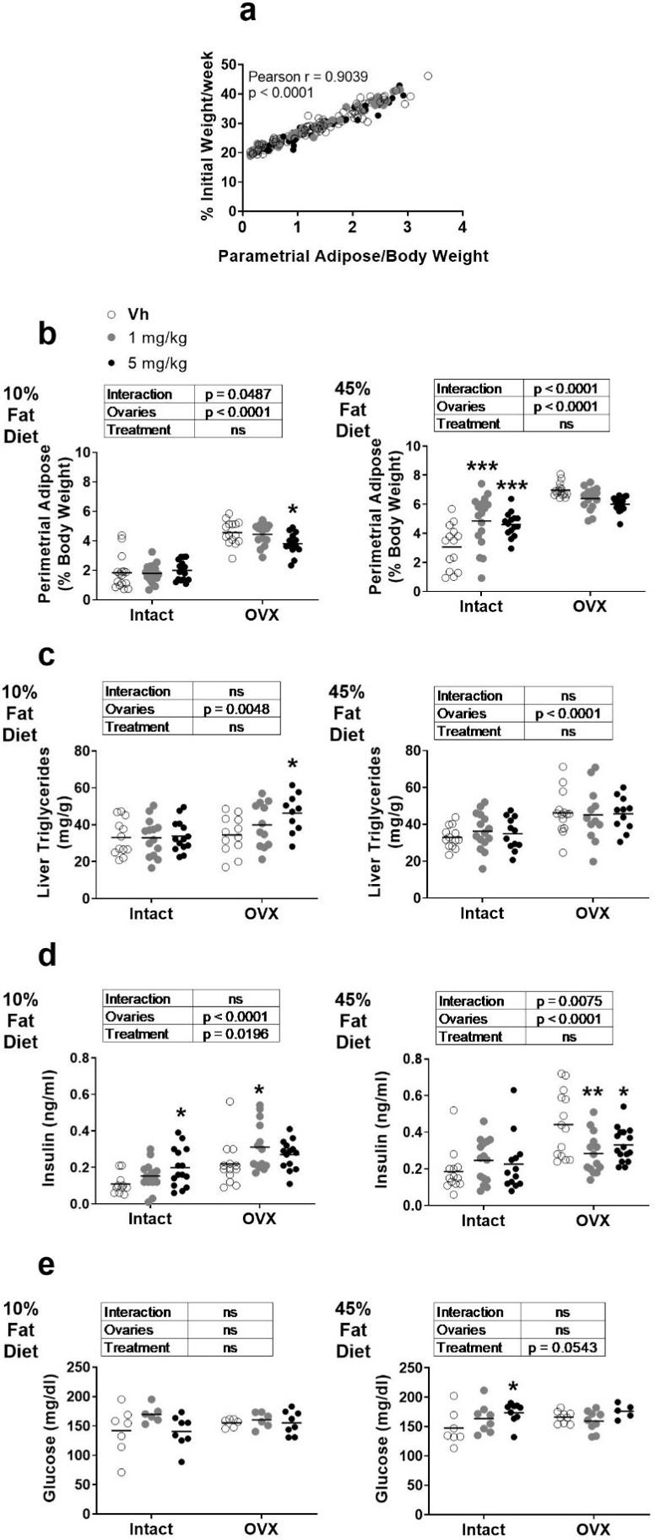
Figure 1.

Metabolic parameters in female intact or ovariectomized (OVX) C57Bl/6J mice fed a 10% or 45% fat diet and treated with TBT. Panel a: Rate of weight gain versus parametrial adipose weight. Mice across the four cohorts are indicated by shading of the points. Panel b: Parametrial adipose weight. Panel c: Liver triacylglyceride concentration. Panel d: Serum insulin. Panel e: Serum glucose. Data are presented from individual mice, and the mean is indicated by a line. n=14–17 individual mice. Boxes show results of Two-way ANOVA. *p < 0.05, **p<0.01 versus Vh, Dunnett’s multiple comparison test.
