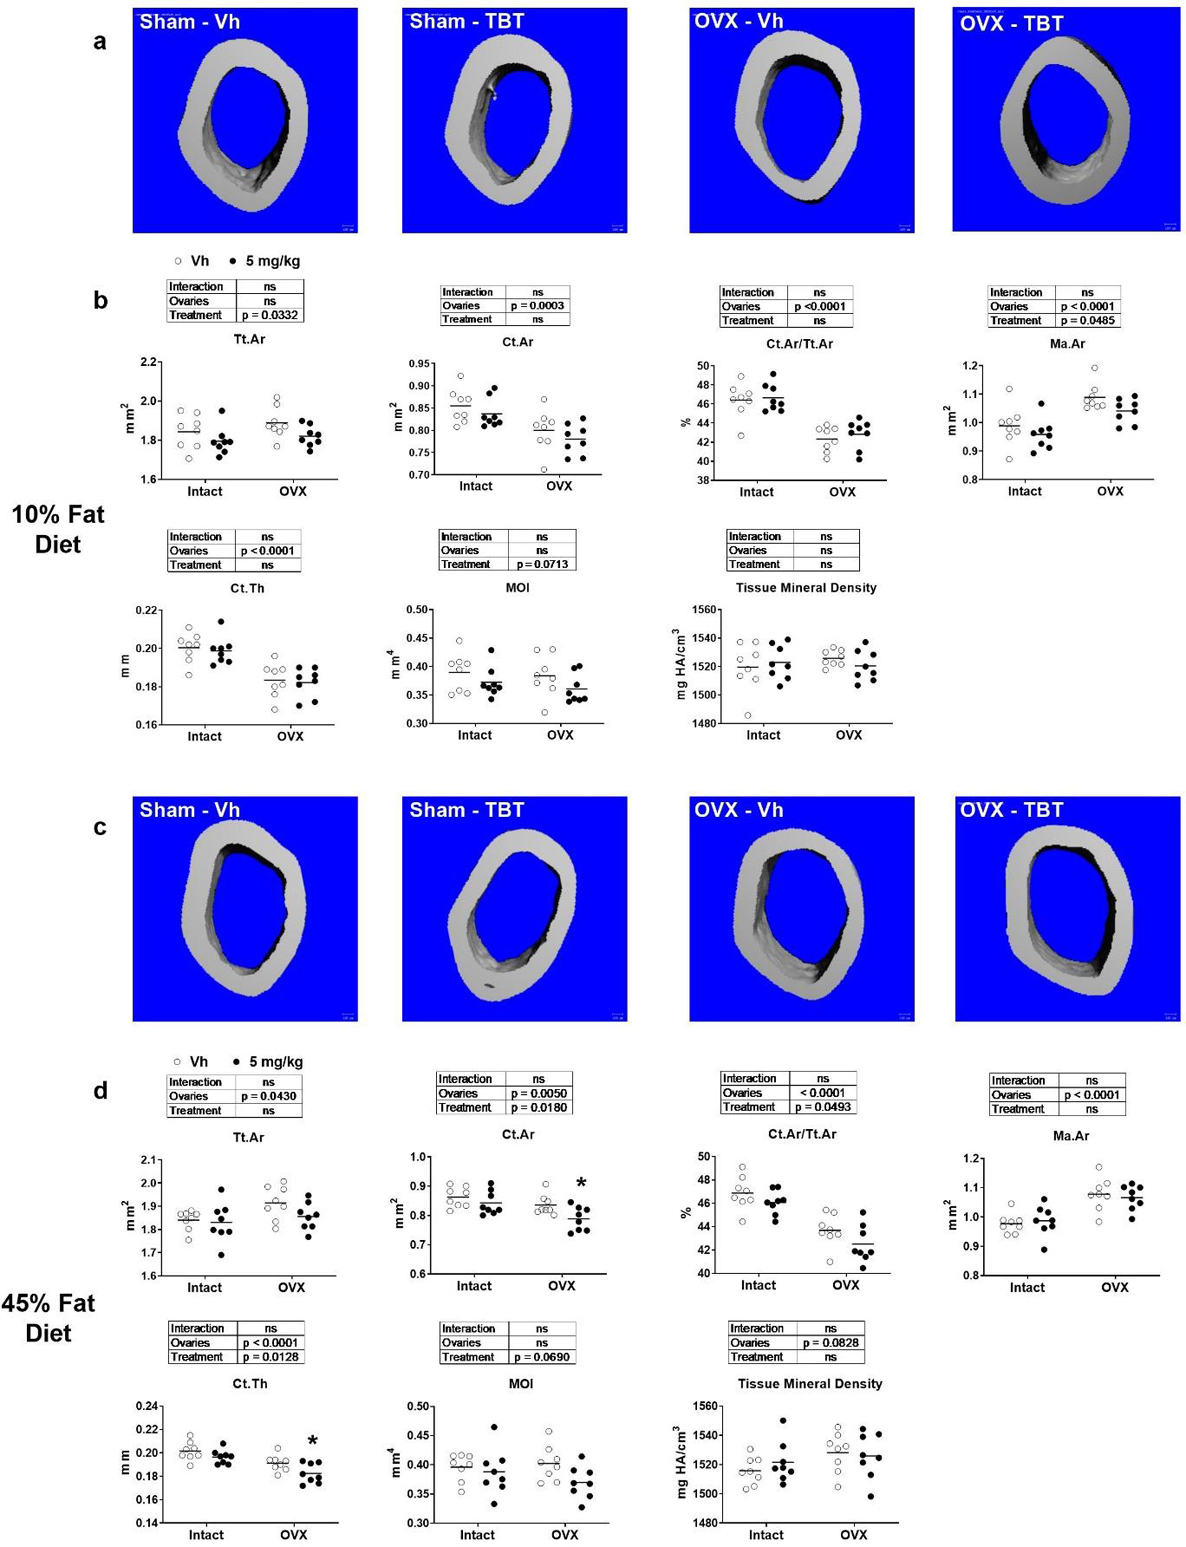
Figure 3.

micro-CT analysis of femur cortical parameters. Panel a: Representative micro-CT images of mid-diaphysis of low fat fed mice. Panel b: Cortical bone parameters of low fat fed mice. Panel c: Representative micro-CT images of mid-diaphysis of high fat fed mice. Panel d: Cortical bone parameters of high fat fed mice. Ct.Th: cortical bone thickness; Ct.Ar: cortical bone area; Ma.Ar: medullary (marrow) area; Tt.Ar: total cross-sectional area; Ct.Ar/Tt.Ar: cortical area fraction; MOI: moment of inertia; mineral density. Data are presented from individual mice, and the mean is indicated by a line. n=6 individual mice. Boxes show results of Two-way ANOVA. *p<0.05, **p<0.01 versus Vh, Sidak’s multiple comparison test.
