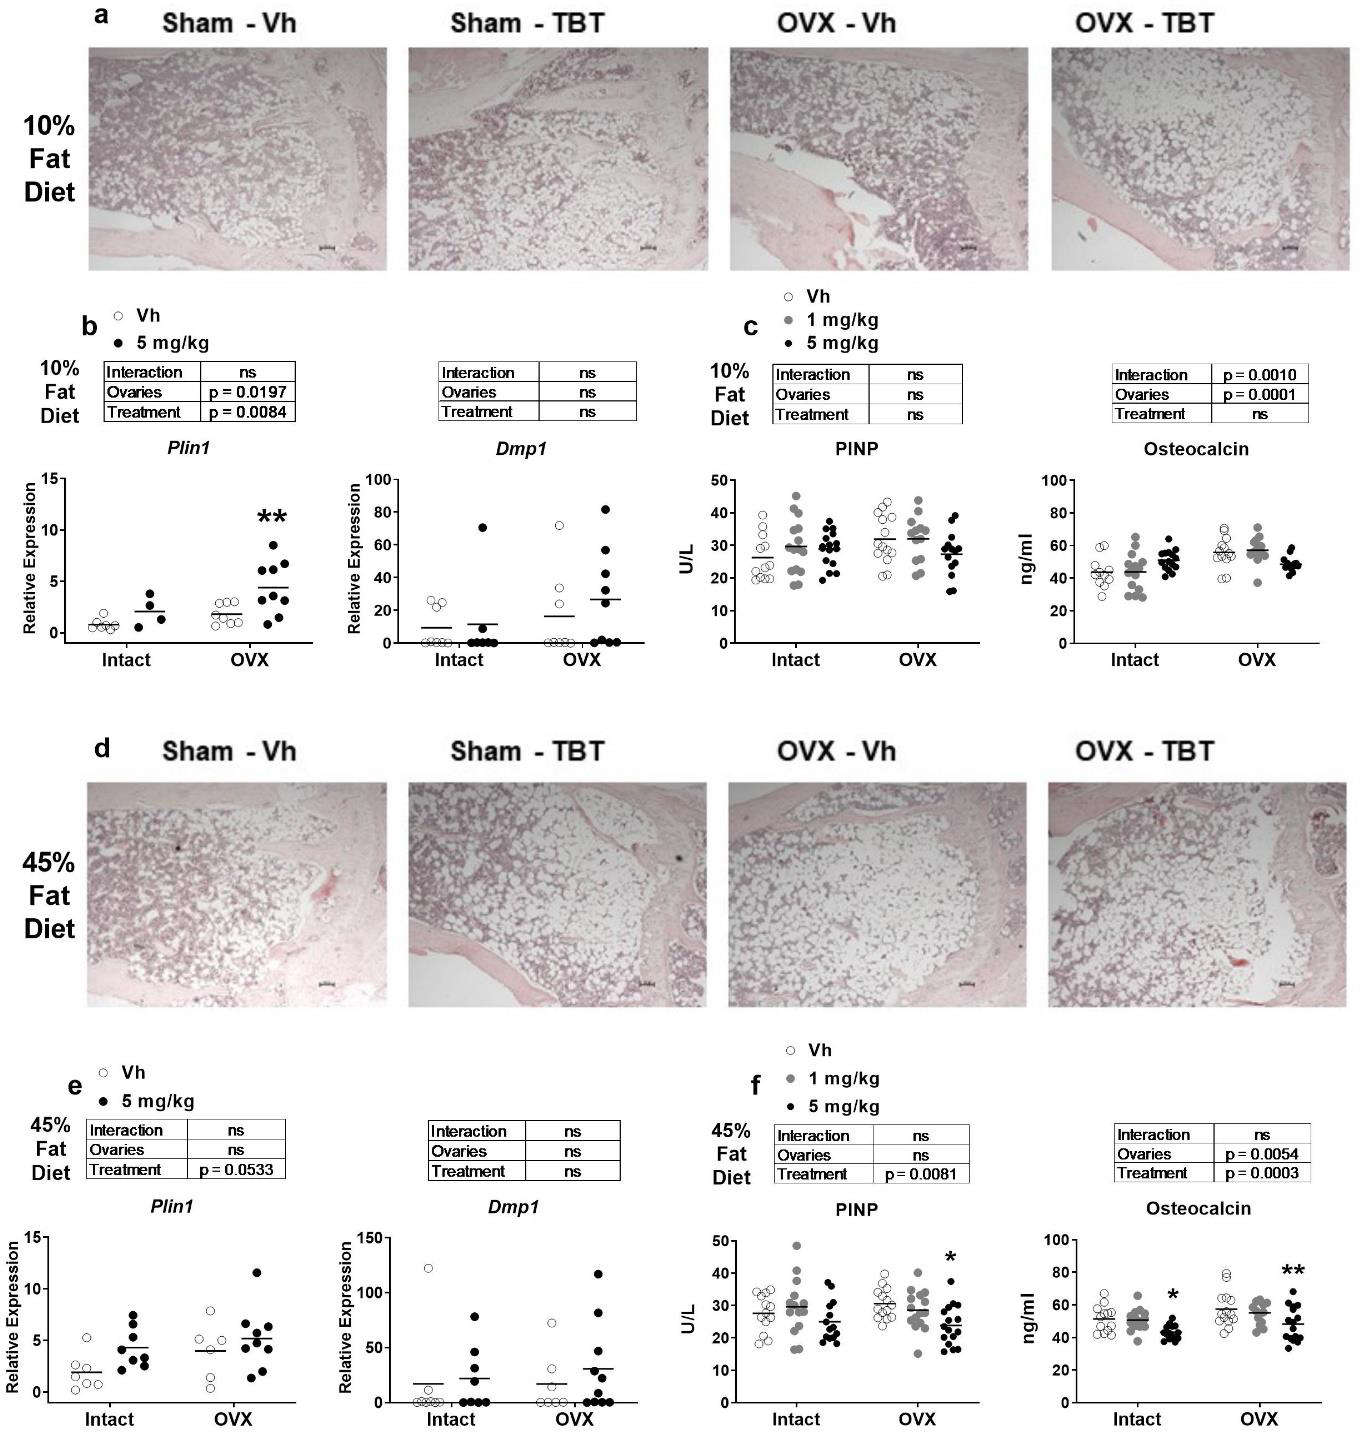
Figure 5.

Analyses of bone formation. Panels a and d: Representative images of 5 μm slices of distal femur (n=4–6) stained with hematoxylin and eosin (4x magnification). Scale bar = 100 μm Panels b and e: mRNA expression of an adipocyte (Plin1) and osteoblast (Dmp1) biomarker genes from whole tibia (n=7–9). Panels c and f: Quantification of serum PINP and OCN (n=11–15). Data are presented from individual mice, and the mean is indicated by a line. Boxes show results of Two-way ANOVA. *p < 0.05, **p<0.01 versus Vh, Sidak’s (c, d) or Dunnett’s (e, f) multiple comparison test.
